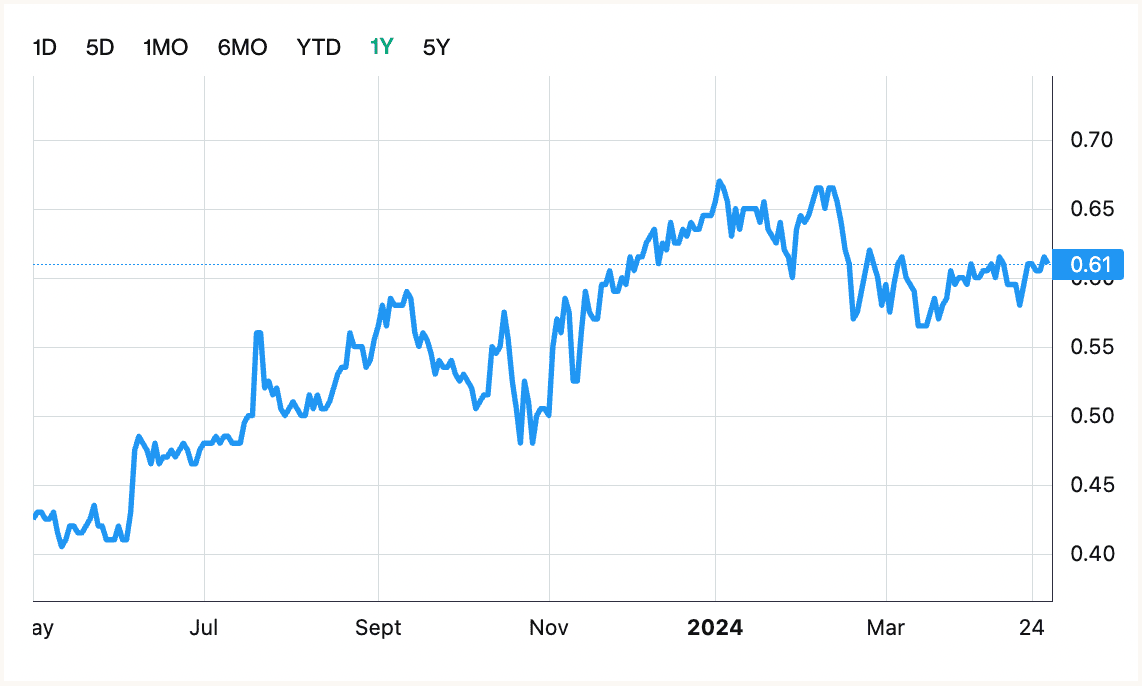
On Monday, Noble re-test the resistance at $1.50 and closed at $1.485 with LOW volume of 41.2 million shares traded.
A long lower shadow occurred. This is typically a bullish signal (particularly when it occurs near a low price level, at a support level, or when the security is oversold).
RSI & MACD are bullish as RSI trend upwards.
Important Resistance of Noble: $1.50
Immediate Support of Noble: $1.42
Currently prices are supported by 50 days MA.
For the past 2 trading sessions, it is obvious that the buying pressure has weaken as the trading volume falls.
The resistance at $1.50 is expected to be very strong.
In fact, the candle stick with long lower shadow already affirms that investors began to take profit ahead of this resistance.
Watch $1.50 resistance closely for this week if vested.
Stock Chart: Noble Grp! is contributed ...
...