On Friday, Midas trend sideways and closed at $0.395 with LOW volume of 6.67 million shares traded.
During the past 10 bars, there have been 3 white candles and 6 black candles for a net of 3 black candles. During the past 50 bars, there have been 17 white candles and 28 black candles for a net of 11 black candles.
Both RSI & MACD are flat as MACD lines converge together.
Important Resistance of Midas: $0.435
Immediate Support of Midas: $0.375
Currently prices are resisted by 200 days MA at $0.435.
Since Sept 2011, prices have been consolidation between the support at $0.315 and key resistance at $0.435.
The resistance at $0.435 is expected to be very strong.
Do not suggest to buy near this resistance of $0.435 as the bears will short on this level.
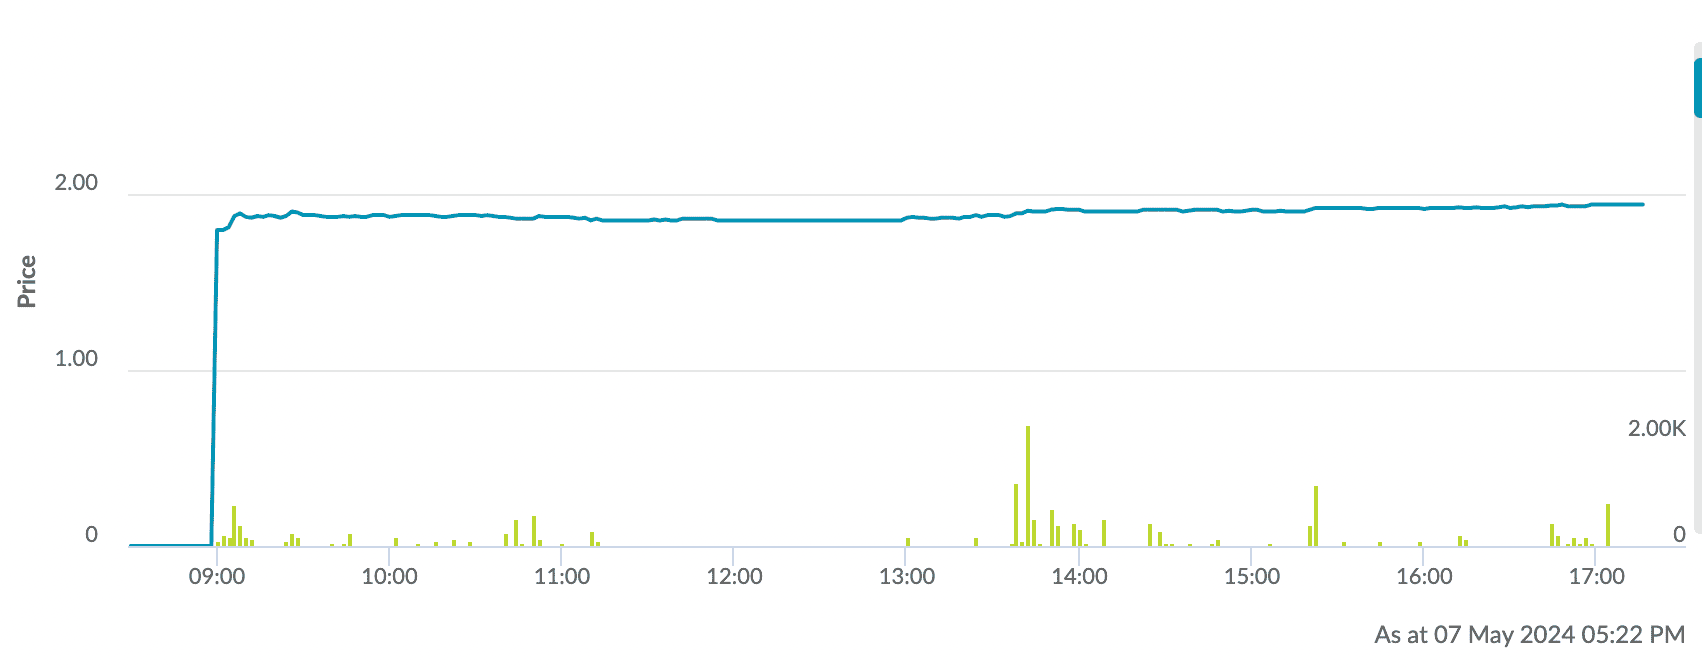
Stock Chart: Midas! ...
...