


Thought this is quite a nice chart to look at. There's a descending wedge (with declining volume) and upon breakout of the upper trend line with higher volume and subsequently re-testing it, it seems that it's a good bet. Could be a gap cover too. Expected target is 3.19 thereabout, entry 3.04 to 3.05. Capital requirement is quite high for this counter, so the returns are not as high as a percentage.
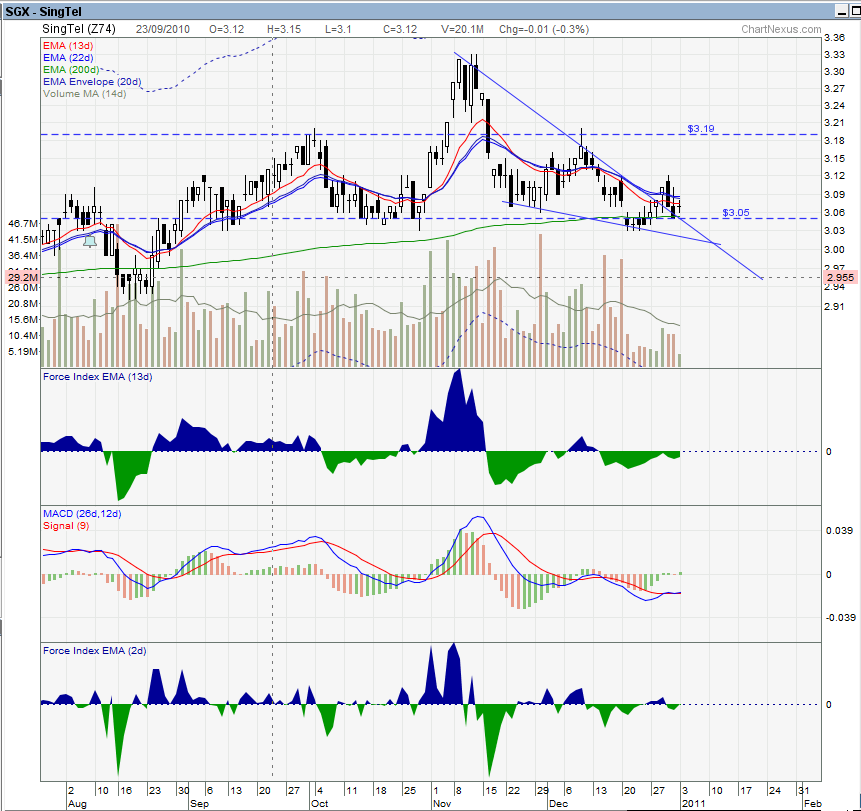
If the price goes below the lower trendline, especially with high volume, then the pattern fizzles out. So, I'll be looking at a strong support near 3.04. Goes below that, bullishness associated with the pattern is gone. As usual, this is not a recommendation to trade. I'm simply looking to see if my skills in TA are sharp or not....


