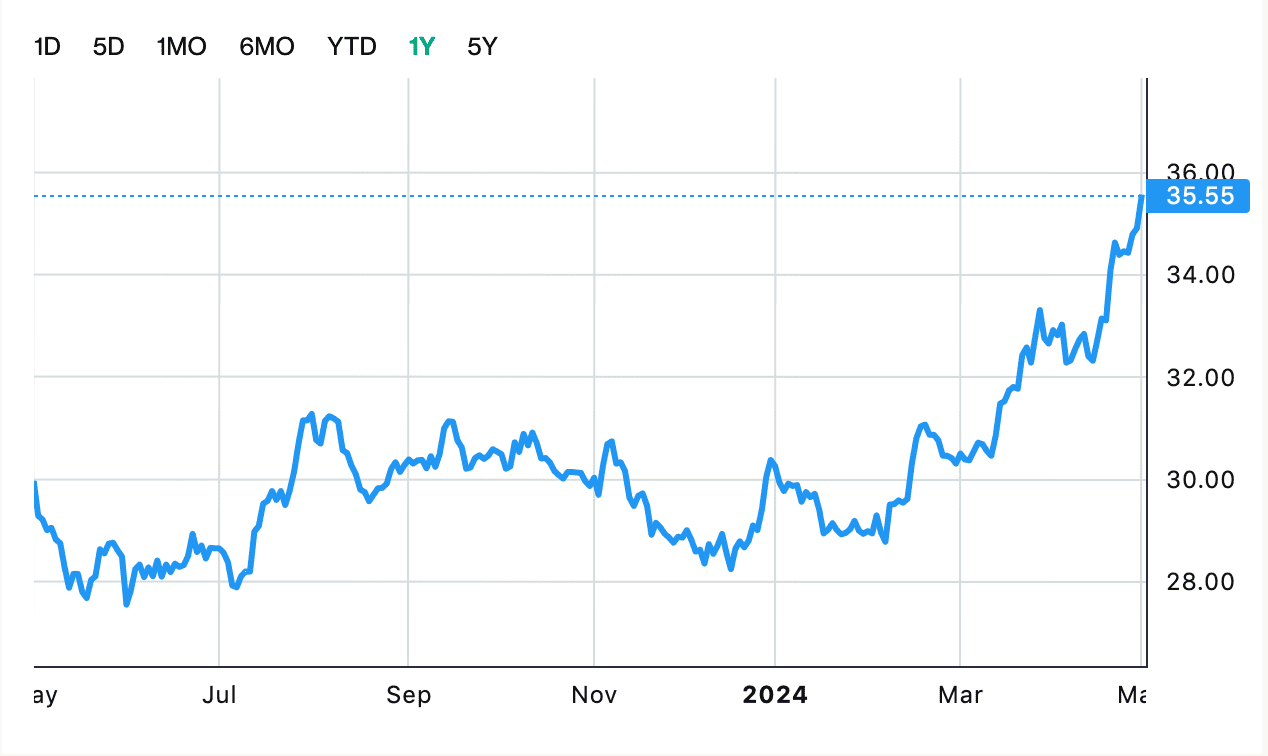
On Monday, Kepcorp re-test the critical resistance at $11.14 and closed at $11.14 with HIGH volume of 6.25 million shares traded.
Both RSI & MACD are bearish as RSI trend downwards.
Important Resistance of Kepcorp: $11.58
Immediate Support of Kepcorp: $11.14
Currently prices are supported by 100/200 days MA.
For the past 2 trading sessions, prices have been undergo heavy selling pressure due to poor earning results.
The resistance at $10.99 is expected to be strong.
We would suggest to wait for prices to rebound on the $10.99 support before entry as the selling pressure is currently very strong.
Stock Chart: KepCorp! is contributed by : Singapore Stock Information Exchange