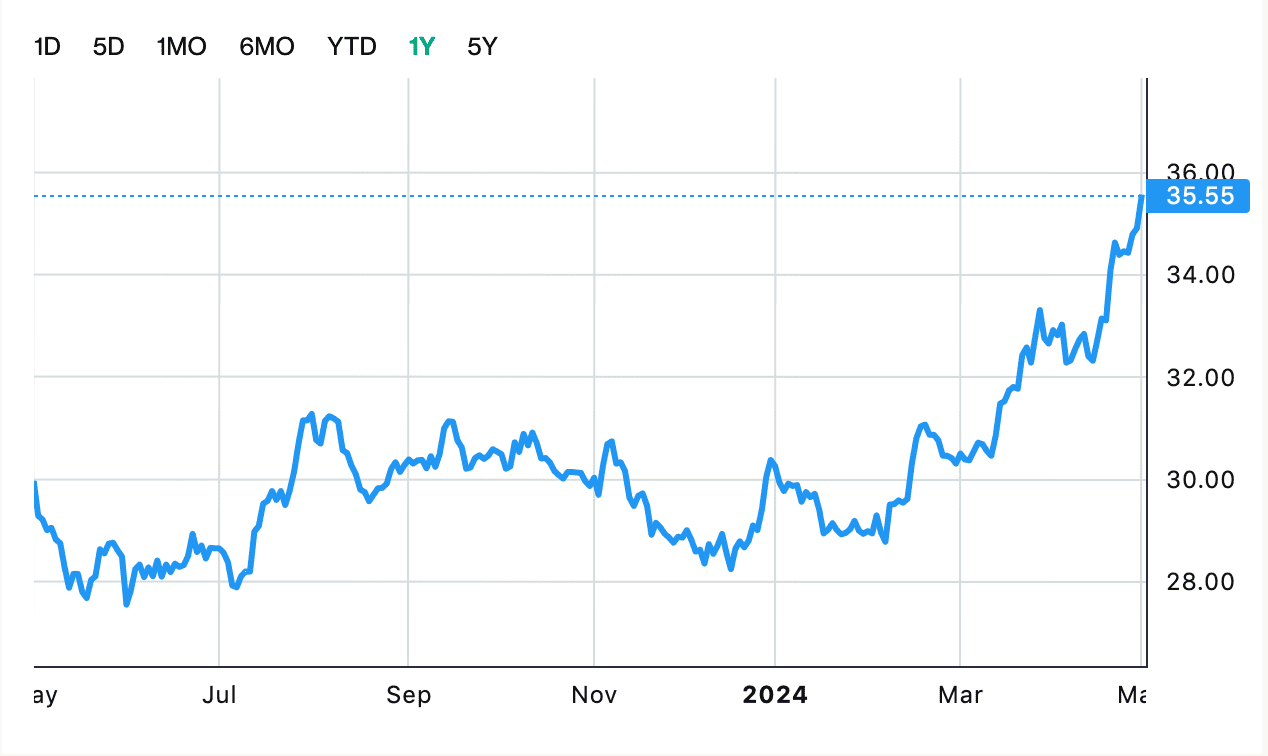
On Tuesday, Sembmar re-test the resistance at $4.38 and closed at $4.33 with LOW volume of 0.852 million shares traded.
RSI & MACD are bullish as RSI trend upwards.
Important Resistance of Sembmar: $4.38
Immediate Support of Sembmar: $4.19
Currently prices are supported by 20/50 days MA.
Since 31/May, prices have been trending sideways between the critical support at $4.19 and resistance at $4.38.
The resistance at $4.38 is expected to be strong.
We do suggest avoiding buying near $4.38 resistance till breakout. Otherwise, do wait for any pullback to the support at $4.19 for better entry level.
Important News
Sembcorp Marine Ltd. (S51.SG) has secured two rig building contracts worth a total of US$417 million from Petroleros Oro Negro, S.A.P.I. de C.V. The rigs are scheduled for delivery at end July 2015 and ...
...