


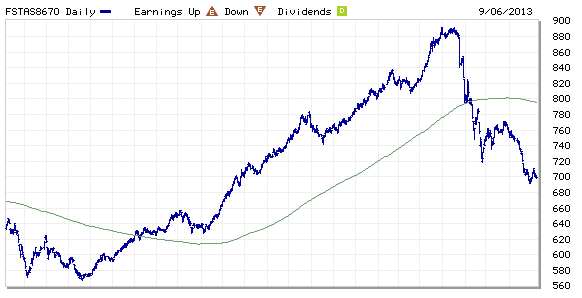
FTSE ST Real Asset Investment Trust (FTSE ST REIT) Index changes from 749.17 to 699.17 compare to last post on Singapore REIT Fundamental Comparison Table on Aug 9, 2013. The index is trading below 200D SMA and technically bearish. Currently the index is trading in Elliott Wave C (down) and no sign of reversal yet.
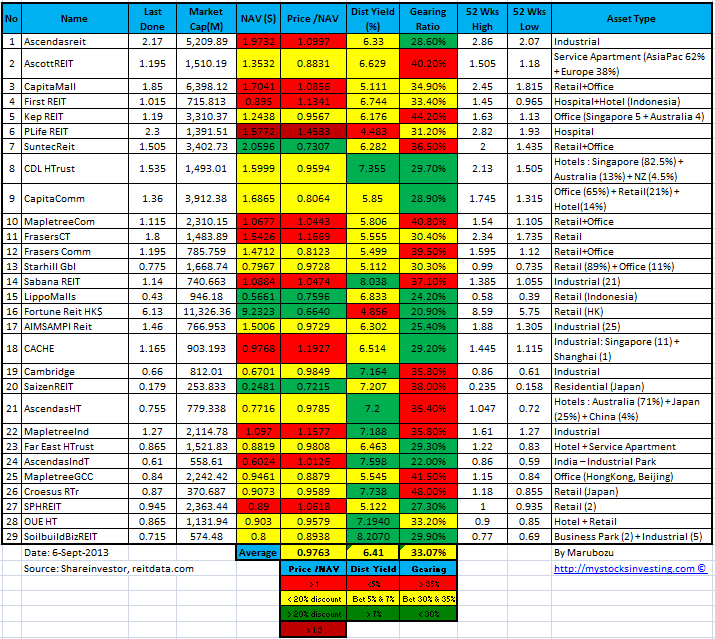
- Price/NAV decreases from 1.0568 to 0.9763.
- Dividend Yield increases from 5.91% to 6.41%.
- Gearing Ratio remains the more or less the same at 33.07%.
- In Short, Singapore REIT become attractive in terms of valuation and distribution yield again. However technically Singapore REIT is still on down trend and the price can go even lower although fundamental looks attractive.
Find out how I do research on Singapore REIT, how to interpret those financial ratio in the comparison table, ...
...


