With reference to Chart 1, Sembmarine may be in the process of breaking out a multi month base formation, as it has breached 4.60-4.61 with volume expansion.
Chart 1: Sembmarine - potential multi month breakout
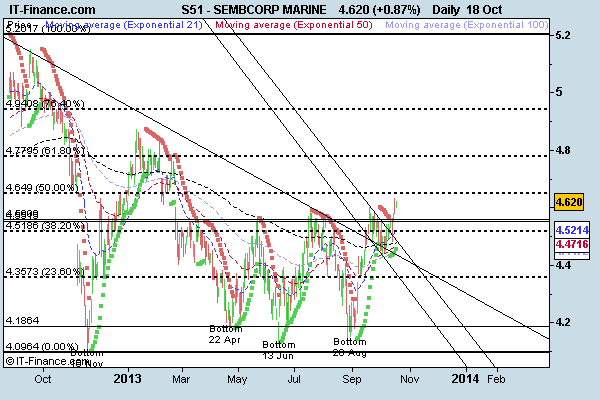
Source: CIMB itrade complimentary chart (18 Oct 13)
Chart observations
1. Chart seems to be forming a giant 6 month bottom formation. In addition, it seems to have broken from the downtrend since Apr 2011. This line is significant as it has 5 – 6 anchor points. Supports around 4.59 – 4.61 / 4.55-4.56 / 4.52. Resistances around 4.65 – 4.66 / 4.71 / 4.78.
Chart 2: Sembmarine – Broke the downtrend since Apr 2011

Source: CIMB itrade complimentary chart (18 Oct 13)
2. Analysts are slowly becoming more positive on Singapore rig builders. The recent positive newsflow and ...
...