It is not a surprise Super Group faced a huge sell off after the recent headline news of “Super: 3Q13 Net Profit Down 17% To S$18.7 Million”.
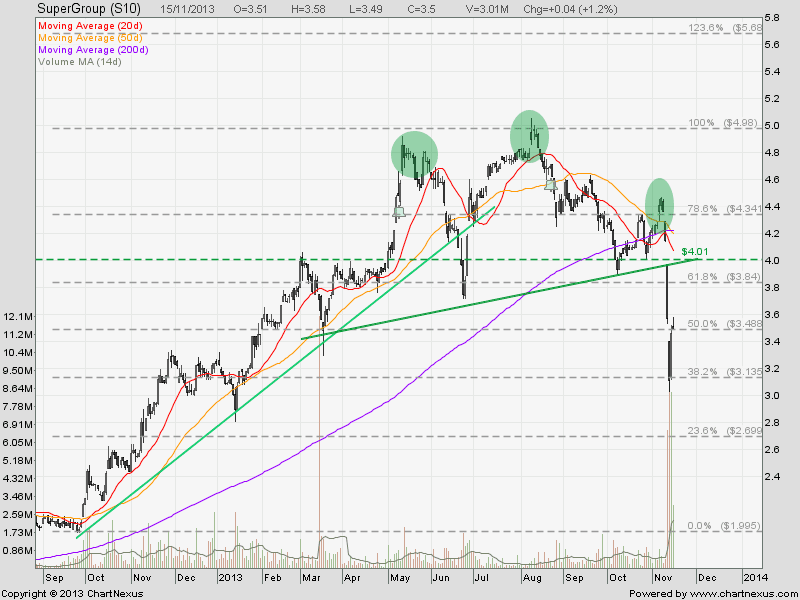
Fundamentally the stock is not cheap base on PE ratio. Technically Super Group is showing a Head and Shoulder and the stock price records a historical high at about $5.00. The shorties have been watching the $4.00 neckline for quite sometimes.
Super Group will start the down trend from now on as the stock has already entered into bearish territory. Watch for the rebound back to $3.50 (50% FR), $3.84 (61.8% FR) or $4.00 (neckline support turned resistance + round number) to short again!
Original post by Marubozu @
My Stocks Investing Journey.
Key Statistics for SUPER
| Current P/E Ratio (ttm) |
19.7406 |
| Estimated P/E(12/2013) |
22.4359 |
| Relative P/E vs. FSSTI |
1.4417 |
| Earnings ... |
...