I thought I'll never write another article on technical analysis again. But here I go again. I trade on divergence, so it's a counter trend trading, if you want to classify which school of TA I'm into. Divergence means that there is a pair of things moving in opposite direction. One of the pair is invariably the price of the counter. The other pair could be any indicator, but the one I'm using is MACD histogram.
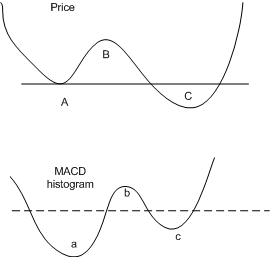
Bullish divergence happens when the price reached a lower low but the indicator reached a higher low. It's easier to explain this with a diagram.
Points A, B, C are the price points of the counter. a, b and c are the indicator points. As mentioned, it can be any indicator but I'm using MACD histogram.
A and a - The price reaches a first deep low and the MACD histogram follows suit and ......