


Published on 19/10/17: www.smartinvestorinc.com
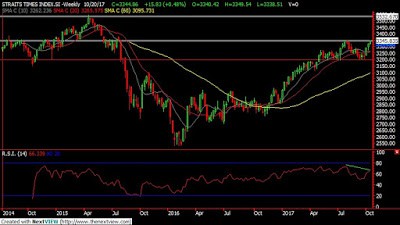
Source: Nextview STI Chart as of 19/10/17 (For illustration purpose)
STI is at a critical resistance of 3350 and if it is able to close above 3360, we will have a bullish signal and medium target could be set at 3460 and 3520 respectively. However, from the weekly charts, there is a divergence spotted on the RSI. So this could potentially be a double top and if it materializes, 3280-3300 will be at sight. At the moment, this is a tough call.
Source: Investing.com US Dollar Index Chart as of 19/10/17 (For illustration purpose only)
Over at the US dollar Index chart, it seems like it is forming a reverse head and shoulder. If it breaks above 94 level, we could likely see a resumption of the US dollar strength.
Disclaimer:
The information contained in this publication is provided to you for general information only and is not...


