A re-rating of the global Information Technology (“IT”) Sector took place earlier this year, which has seen Singapore’s IT Sector grow by two-thirds, from a combined market capitalisation of S$9.7 billion to S$16.1 billion.
The 10 largest IT stocks averaged a 95% price gain (with the median gain at 96%) for the 2017 YTD. The 10 stocks that saw the greatest price gains were Hi-P International and Micro-Mechanic Holdings, with Venture Corp and Valuetronics Holdings generating similar gains.
Three of the 10 largest IT stocks have reported for the Sep 17 quarter. For the quarter, Venture Corp reported 135% YoY growth in net profit, Hi-P International reported 25% YoY growth in profit after tax, and Micro-Mechanic Holdings reported 53% YoY growth in net profit.
A global and regional upswing in the Information Technology (“IT”) Sector over the first 10 months of 2017 has seen the MSCI World Information Technology Index generate a 29.3% price gain, and the MSCI Asia Information Technology Index gain 47.8%.
The global re-rating of the Sector which took place earlier this year has also seen Singapore’s biggest IT stocks generate significant gains. With higher worldwide semiconductor sales, in addition to higher end demand for consumer electronics, both upstream and downstream technology companies have benefitted from the global swing. For instance, upstream high precision manufacturers UMS Holdings and Micro-Mechanics Holdings gained 116% and 148.6% respectively, whilst the more downstream Venture Corp and Valuetronics Holdings gained 122.6% and 122.1% respectively.
This has seen the combined market capitalisation of Singapore’s IT Sector grow 66% from S$9.7 billion at the end of 2016, to S$16.1 billion as of yesterday.
Market Capitalisation of Singapore’s IT Sector (S$ Billion)
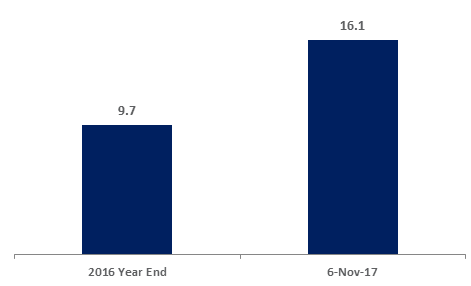
Source: SGX StockFacts, Bloomberg
Recent Earnings Releases
Three of Singapore’s 10 largest IT stocks have reported for the Sep 17 quarter. For the quarter, Venture Corporation reported 135% YoY growth in net profit, Hi-P International reported 25% YoY growth in profit after tax, and Micro-Mechanic Holdings reported 53% YoY growth in net profit.
Venture attributed its results to driven by strong revenue growth and value creation through engineering and research & development capabilities. Hi-P International noted that the jump in gross profit and gross margin was driven by driven by better capacity utilisation, manufacturing yield improvement and cost controls. Micro-Mechanics Holdings noted that its 3QFY17 profit growth was achieved on the back of revenue growth of 32.5% to S$17.7 million, and a higher gross profit margin of 60.9%, with a tight rein on expenses.
Outside the 10 largest IT stocks, the next two largest stocks have also reported financials for the September 2017 quarter:
- iFAST Corporation reported that including China operation and tax expense, the Group’s net profit after tax increased by $0.41 million or 21.5% from $1.91 million in its 3QFY16, to $2.32 million in its 3QFY17. The Group noted that the YoY increases in 3QFY17 were due mainly to the growth of the Group’s business and Asset Under Administration (“AUA”) in both Business-to-Customer (“B2C”) and Business-to-Business (“B2B”) business divisions in the period, contributed by the Group’s continuing efforts at strengthening its investment platforms in the various countries in the recent years.
- AEM Holdings reported profit after tax for its 3QFY17 was up 320.5% YoY to S$9.427 million. AEM Holdings noted that the commercial success of the Group’s next generation semiconductor handler platform continues to drive sales and profit growth this year as the platform progresses through its multi-year commercial ramp.
Singapore’s Largest Information Technology Stocks
As tabled below, Singapore’s 10 largest IT stocks averaged a 95.0% price gain (with the median gain at 95.8%) for the 2017 year thus far. Of the 10 stocks those that saw the greatest price gains were Hi-P International, Micro-Mechanic Holdings, with Venture Corp and Valuetronics Holdings generating similar gains.
As noted above, the MSCI World Information Technology Index generated a 29.3% price gain, with the MSCI Asia Information Technology Index gaining 47.8%. These are price returns, calculated in SGD terms. On the valuation front:
- The MSCI World Information Technology Index currently maintains a Price-to-Earnings (P/E) ratio of 25.9 times, a Price-to-Book (P/B) ratio of 4.8 times and twelve month trailing dividend yield of 1.2%.
- The MSCI Asia Information Technology Index currently maintains a Price-to-Earnings (P/E) ratio of 21.4 times, a Price-to-Book (P/B) ratio of 2.9 times and twelve month trailing dividend yield of 1.3%.
The comparative valuations of the Singapore’s IT stocks are also tabled below. To see more details of each stock in SGX StockFacts, click on the stock names below.
Source: Bloomberg & SGX StockFacts (data as of 6 November 2017).
*Last price of companies are denoted in their respective trading currencies.
Singapore’s next largest 10 IT stocks by market capitalisation averaged an 81.5% price gain (with the median gain at 19.2%) for the 2017 year thus far. The best performing stock of the 10 in the year thus far was AEM Holdings.
As noted above, AEM Holdings reported profit after tax for its 3QFY17 was up 320.5% YoY to S$9.427 million. For the first nine months of 2017, AEM Holdings’ net profit was up 469.9% YoY to S$21.776 million. AEM Holdings provides handling and test solutions to advanced manufacturers – delivering products in the 5G economy including microprocessors, high speed communications, IOT devices and solar cells.
To see more details of each stock in SGX StockFacts, click on the stock names below.
| Name |
SGX Code |
Market Cap S$M |
Last Price* |
Price Change YTD % |
Total Return YTD % |
P/E (x) |
P/B (x) |
Dvd Ind Yld % |
| iFAST Corp |
AIY |
249 |
0.940 |
11.2 |
15.1 |
32.1 |
3.1 |
3.0 |
| AEM Hldgs |
AWX |
228 |
3.480 |
507.0 |
516.2 |
10.0 |
4.5 |
0.3 |
| CSE Global |
544 |
194 |
0.375 |
-17.6 |
-12.3 |
N/A |
0.9 |
7.3 |
| Memtech International |
BOL |
161 |
1.145 |
81.7 |
87.3 |
8.7 |
1.0 |
2.1 |
| Serial System |
S69 |
156 |
0.174 |
21.7 |
24.9 |
8.6 |
0.9 |
2.6 |
| PCI |
P19 |
147 |
0.740 |
64.4 |
80.9 |
10.2 |
1.2 |
4.1 |
| Ellipsiz |
BIX |
144 |
0.860 |
138.9 |
172.6 |
16.9 |
1.1 |
3.5 |
| Nera Telecommunications |
N01 |
134 |
0.370 |
-7.5 |
-3.9 |
18.6 |
2.0 |
4.1 |
| DISA |
532 |
141 |
0.014 |
16.7 |
16.7 |
N/A |
3.1 |
N/A |
| Hengxin Technology |
I85 |
120 |
0.310 |
-1.6 |
-0.1 |
5.0 |
0.4 |
1.7 |
| Average |
|
|
|
81.5 |
89.7 |
13.8 |
1.8 |
3.2 |
| Median |
|
|
|
19.2 |
20.8 |
10.1 |
1.2 |
3.0 |
Source: Bloomberg & SGX StockFacts (data as of 6 November 2017).
*Last price of companies are denoted in their respective trading currencies.
According to SGX’s fund flow data (click
here), for the first 10 months of 2017, institutional fund flow into the IT sector was a net buy amount of S$169.3M. Institutional fund flow into the IT sector was the third largest amongst the GICS® sectors, after Financials and Real Estate (excluding REITs).
This document is not intended for distribution to, or for use by or to be acted on by any person or entity located in any jurisdiction where such distribution, use or action would be contrary to applicable laws or regulations or would subject Singapore Exchange Limited (“SGX”) to any registration or licensing requirement. This document is not an offer or solicitation to buy or sell, nor financial advice or recommendation for any investment product. This document is for general circulation only. It does not address the specific investment objectives, financial situation or particular needs of any person. Advice should be sought from a financial adviser regarding the suitability of any investment product before investing or adopting any investment strategies. Use of and/or reliance on this document is entirely at the reader’s own risk. Further information on this investment product may be obtained from www.sgx.com. Investment products are subject to significant investment risks, including the possible loss of the principal amount invested. Past performance of investment products is not indicative of their future performance. Examples provided are for illustrative purposes only. While each of SGX and its affiliates (collectively, the “SGX Group Companies”) have taken reasonable care to ensure the accuracy and completeness of the information provided, each of the SGX Group Companies disclaims any and all guarantees, representations and warranties, expressed or implied, in relation to this document and shall not be responsible or liable (whether under contract, tort (including negligence) or otherwise) for any loss or damage of any kind (whether direct, indirect or consequential losses or other economic loss of any kind, including without limitation loss of profit, loss of reputation and loss of opportunity) suffered or incurred by any person due to any omission, error, inaccuracy, incompleteness, or otherwise, any reliance on such information, or arising from and/or in connection with this document. The information in this document may have been obtained via third party sources and which have not been independently verified by any SGX Group Company. No SGX Group Company endorses or shall be liable for the content of information provided by third parties. The SGX Group Companies may deal in investment products in the usual course of their business, and may be on the opposite side of any trades. SGX is an exempt financial adviser under the Financial Advisers Act (Cap. 110) of Singapore. The information in this document is subject to change without notice. This document may only be onward disseminated by the recipient wholly or in part if its content is attributed to SGX. This document shall not otherwise be reproduced, republished, uploaded, linked, posted, transmitted, adapted, copied, translated, modified, edited or otherwise displayed or distributed in any manner without SGX’s prior written consent.”