


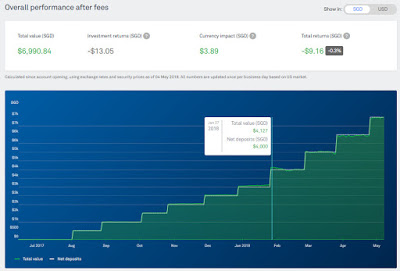
The graph is now much more interactive and it allows you to look at historical portfolio value. In addition, there are now 2 distinct lines/plots that show your investment/capital (net deposit) VS the market value.
We have decided to invest more money (from $500 to $1,000 monthly) through StashAway since January 2018 and I blogged about it here - Automating Capital Growth Through StashAway.
1. ACCOUNT SUMMARY (as of the last day of the month)
Based on the statement (30 Apr 2018), we lost -$31.49.As of 4 May 2018, we lost -$9.16 mostly with a positive currency impact of $3.89. I am kinda sad that USD has recovered so quickly. Definitely would have preferred it to stay lower at least till the end of this year after we return from our US honeymoon :( SGD time-weighted returns: -0.3%
USD time-weighted returns: -0.4%
2. PORTFOLIO DETAILS
3. TRANSACTIONS
SGD $990.00 converted to USD $745.45 (USD $756.24 last...


As the author of this new performance chart, I greatly appreciated it.