Invest
STI Analysis — the next peak and trough ? (44)
By ccloh Strategic Investor Zone  •  April 19, 2019
Continued from STI Analysis -- the next peak and trough ? (43)

Before analyzing STI, will be looking at 2 other indices to provide a clearer direction for STI.

HSI
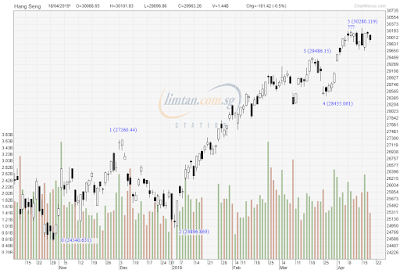
HSI has long been a leading indicator for STI as most will have observed how HSI intra-day movement can affect STI.

Above is the HSI chart clearly doing a 5-wave Elliott wave impulse.  The question is has wave 5 completed or still have a bit more to go.  After wave 5 what's followed shall be the corrective wave of A-B-C.  How deep the correction will depend on the degree of this 5-wave impulse -- a wave 1 of higher degree or a wave 3 of higher degree. Above is the snapshot of of the Fibonacci Calculator taking in the exact happened value for wave 1 to 4.  The generated wave 5 value is 30842.298 as shown.  The highest HSI achieved so far was...
Read the full article
By ccloh Strategic Investor Zone
Am a typical retail investor who started investing in stock market in 1993, the same length of period as SingTel was listed in SGX and ironically SingTel was my first vested stock. Back then was a passive investor and started to turn more active in stock market in 2006. A year later when I switched my engineering job to a finance related one, I became what commonly known as trader ( trade for living ) and at the same time also strongly believe in fundamental/value investing that is the way to growth wealth. In a way I classify myself as a "Strategic Investor". As a trader, I track market movement daily and as an value investor, I am always on the lookout for cheap bargain to hold for long term.
LEAVE A COMMENT
LEAVE A COMMENT

Your email address will not be published.

*

Your Email Address will not be published
*

Read More Articles
More from thefinance