


Straits Time Index has come down by 5.5% since my last bubble chart report on 5/2. That's -186 points. So investing in ETF is not that straight forward. Timing helps as previously mentioned.
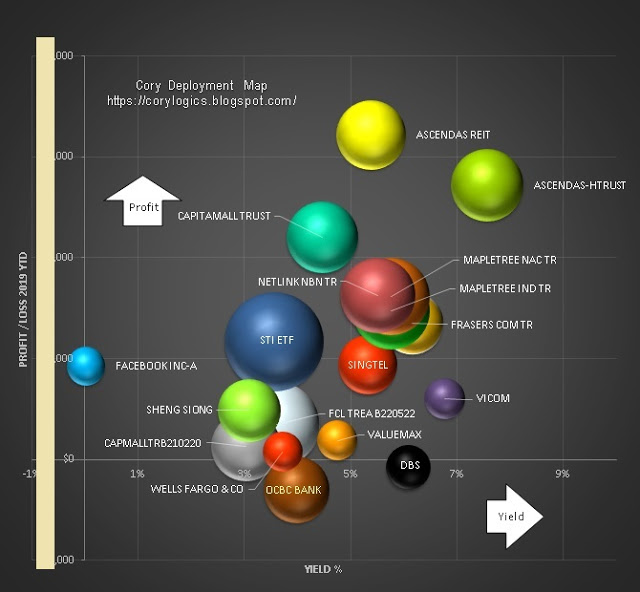
With the recent correction, I have increased my stake in STI ETF. With corresponding profit taking in some of my REIT counters, ETF is now the largest counter. This can be easily observed from the bubble size.
Let's do a review of the Bubble Chart below.
First the bad news.
1. Unlike past bubble chart, there aren't need t do Axis adjustment to fit higher earning. ( Due to risk adjusted )
2. Banks are still in doldrums .... . ( Trying to bottom fish )
3. STI ETF has come down due to large swing on the straits time index within a month. ( Average down )
Here's the good news
1. Reits / Trust profits have...


