


From previous post.
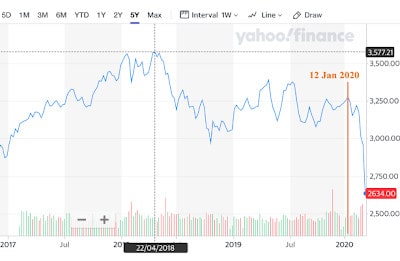
Let’s look at STI chart below. The highest peak is Apr 2018 with STI >3.5K. Bottom out in Oct 2018. The sell-off is led by US-China Trade war.
Covid-19 Crisis
Now let’s look at this virus triggered crisis. 12 Jan 2020, STI is still >3.2K. In fact up to 12 Feb 2020, STI is still >3.2K. Therefore the Peak is Mid Jan 2020.
Source: Yahoo finance
NOW, let’s look at EU debt crisis and Great Financial Crisis.
Debt Crisis
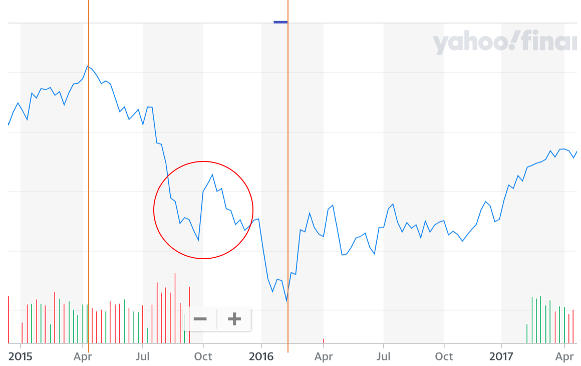
2015 Apr Peak (>3500). End of QE, Fall in oil price and finally Greek debt default in June 2015. China stock turbulence leading the plunge and in Aug when Yuan devalue. Sep plunge below 2800, Oct rise above 3000 short term confidence, oil price drops and so is stock market. Feb below 2600.
Source: Yahoo finance
1) Free Fall - Peak Apr to 1st Trough Sep. 2016 (5 months) – Freefall above 3.5K to below 2.8K...


