Last updated on June 6th, 2021
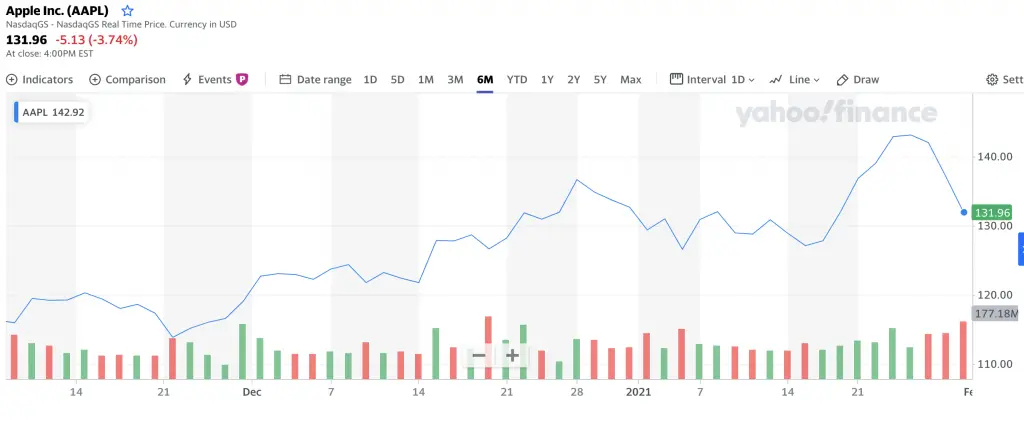
If you have looked at the price of any stock or ETF, you may have seen that the charts have some bars at the bottom. Source: Yahoo Finance
Last updated on June 6th, 2021
If you have looked at the price of any stock or ETF, you may have seen that the charts have some bars at the bottom. Source: Yahoo Finance
 Invest
Quick Take: SSB maximum allotment rises to S$59,500 as demand falls
By Beansprout • June 26, 2024
 Personal Finance
ElderFund: Aid for Singapore’s Elderly | Definitive Guide
By Singapore Financial Planners • June 26, 2024