


"About the only certainty in the stock market is that, over the long haul, overperformance turns into underperformance and vice versa. Is there a pattern to this movement? Let's apply some simple regression analysis (see footnote below) to the question.
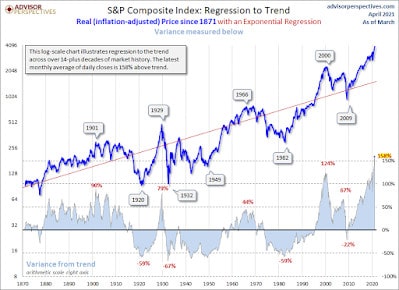
Below is a chart of the S&P Composite stretching back to 1871 based on the real (inflation-adjusted) monthly average of daily closes. We're using a semi-log scale to equalize vertical distances for the same percentage change regardless of the index price range.
The regression trendline drawn through the data clarifies the secular pattern of variance from the trend — those multi-year periods when the market trades above and below trend. That regression slope, incidentally, represents an annualized growth rate of 1.88%."
Every dog has his day ! STI rebounded strongly in 1st Qtr 2021...


