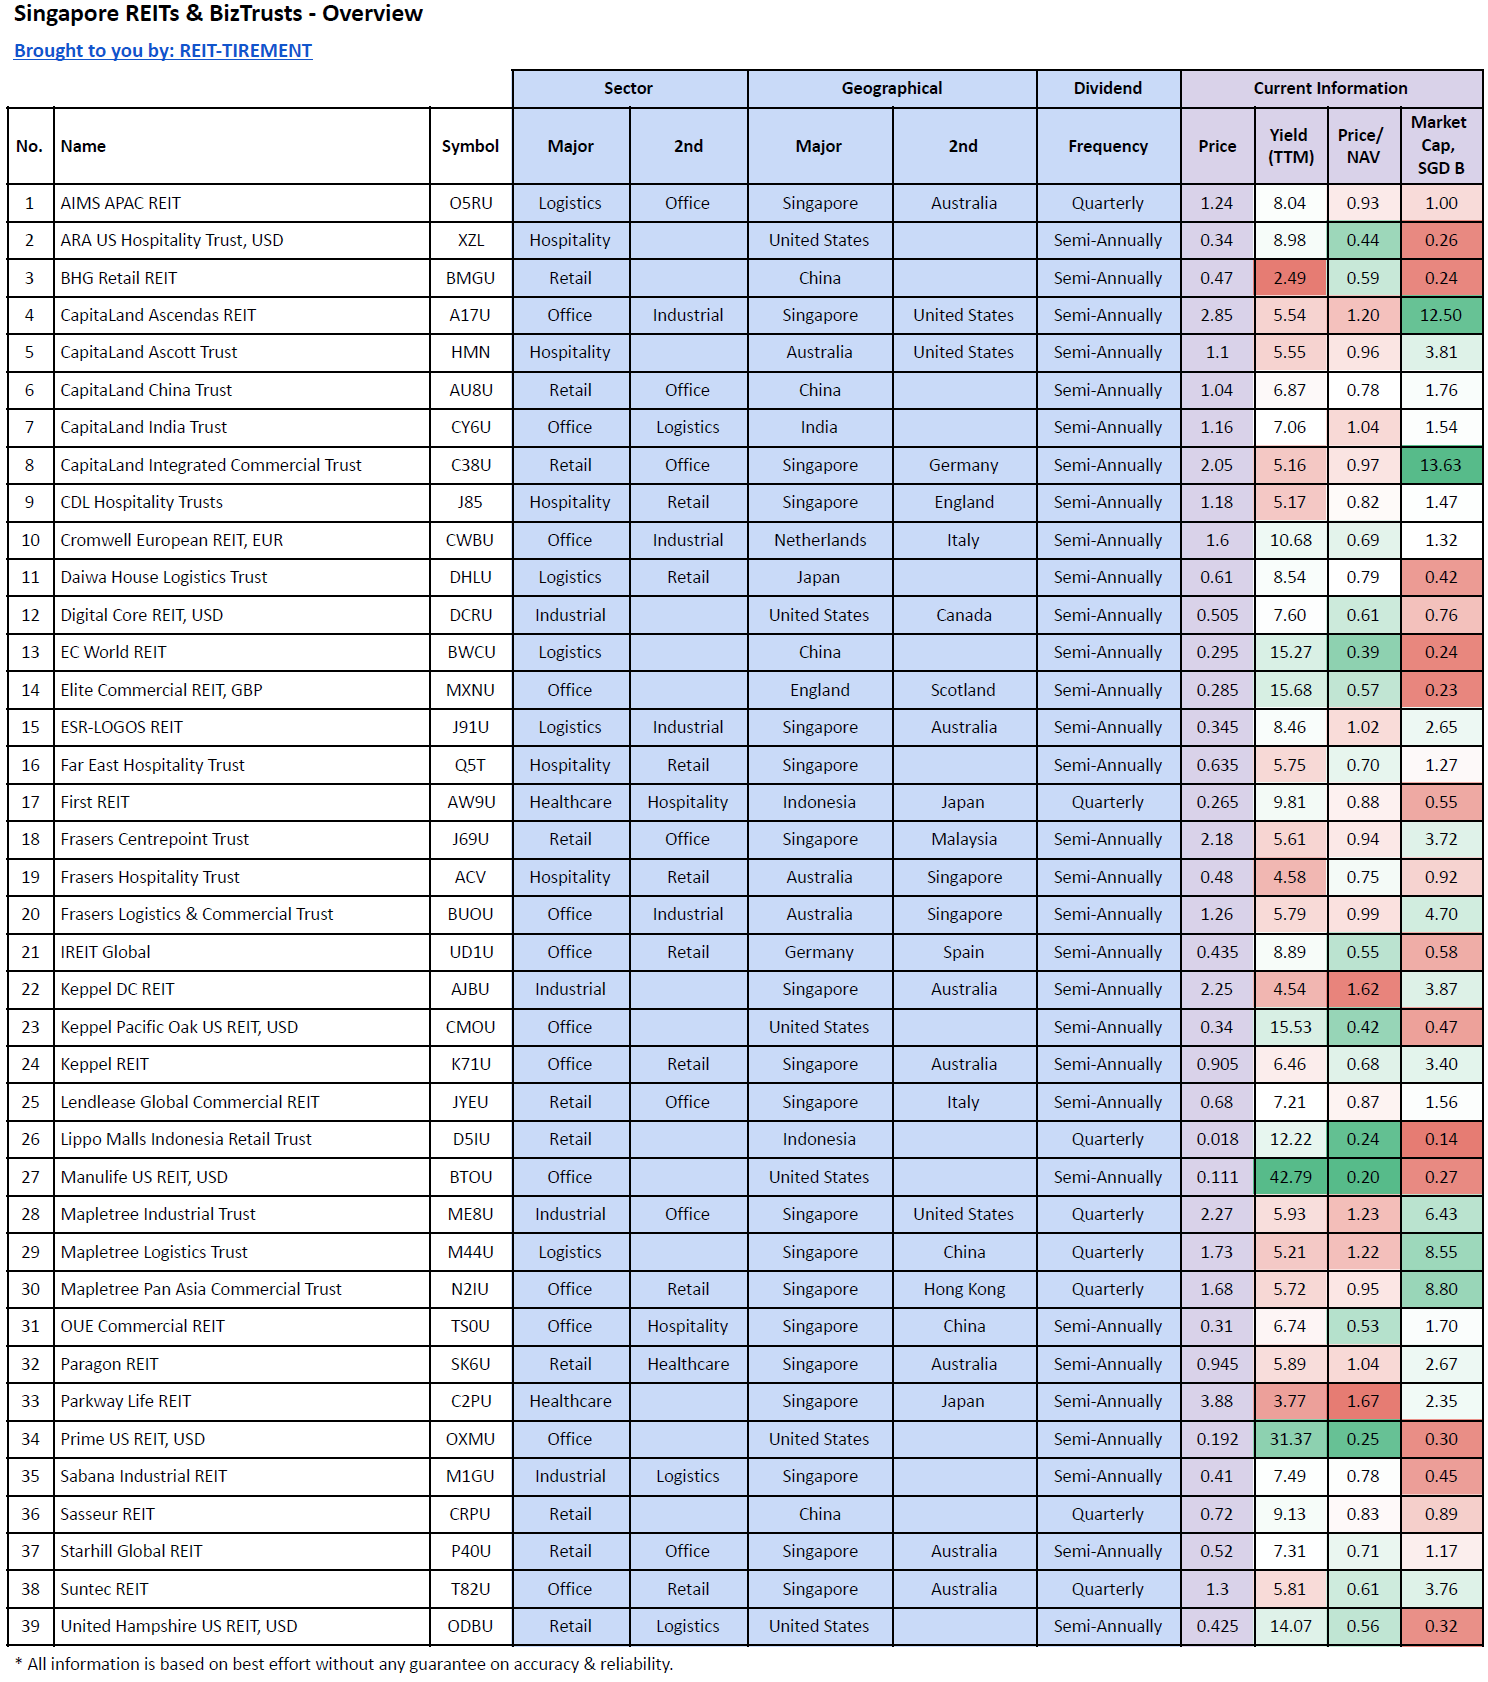
** CapitaLand India Trust is Business Trust
Key Statistics
| Items |
Average |
Median |
Min |
Max |
| Price/ NAV |
0.79 |
0.78 |
0.2 |
1.67 |
| Market Cap, S$ B |
2.58 |
1.32 |
0.14 |
13.63 |
| Dividend Yield - Retail |
7.6% |
7.04% |
2.49% |
14.07% |
| Dividend Yield - Office |
12.93% |
7.06% |
5.54% |
42.79% |
| Dividend Yield - Healthcare |
6.79% |
6.79% |
3.77% |
9.81% |
| Dividend Yield - Hospitality |
6.01% |
5.55% |
4.58% |
8.98% |
| Dividend Yield - Industrial |
6.39% |
6.71% |
4.54% |
7.6% |
| Dividend Yield - Logistics |
9.11% |
8.46% |
5.21% |
15.27% |
| Overall Dividend Yield |
9.2% |
7.06% |
2.49% |
42.79% |
- SREITs in foreign currencies are converted to SGD for Market Cap
** Dividend yields are based on REIT Major Sector
|
Highest Div. Yield (TTM) |
% |
Lowest Div. Yield (TTM) |
% |
| 1 |
Manulife US REIT |
42.79% |
BHG Retail REIT |
2.49% |
| 2 |
Prime US REIT |
31.37% |
Parkway Life REIT |
3.77% |
| 3 |
Elite CommercialREIT |
15.68% |
Keppel DC REIT |
4.54% |
| 4 |
Keppel Pacific Oak US REIT |
15.53% |
Frasers Hospitality Trusts |
4.58% |
| 5 |
EC World REIT |
15.27% |
CapitaLand Integrated Commercial Trust |
5.16% |
|
Highest P/NAV |
Time |
Lowest P/NAV |
Time |
| 1 |
Parkway Life REIT |
1.67 |
Manulife US REIT |
0.2 |
| 2 |
Keppel DC REIT |
1.62 |
Lippo Malls Indonesia Retail Trust |
0.24 |
| 3 |
Mapletree Industrial Trust |
1.23 |
Prime US REIT |
0.25 |
| 4 |
Mapletree Logistics Trust |
1.22 |
EC World REIT |
0.39 |
| 5 |
CapitaLand Ascendas REIT |
1.2 |
Keppel Pacific Oak US REIT |
0.42 |
...