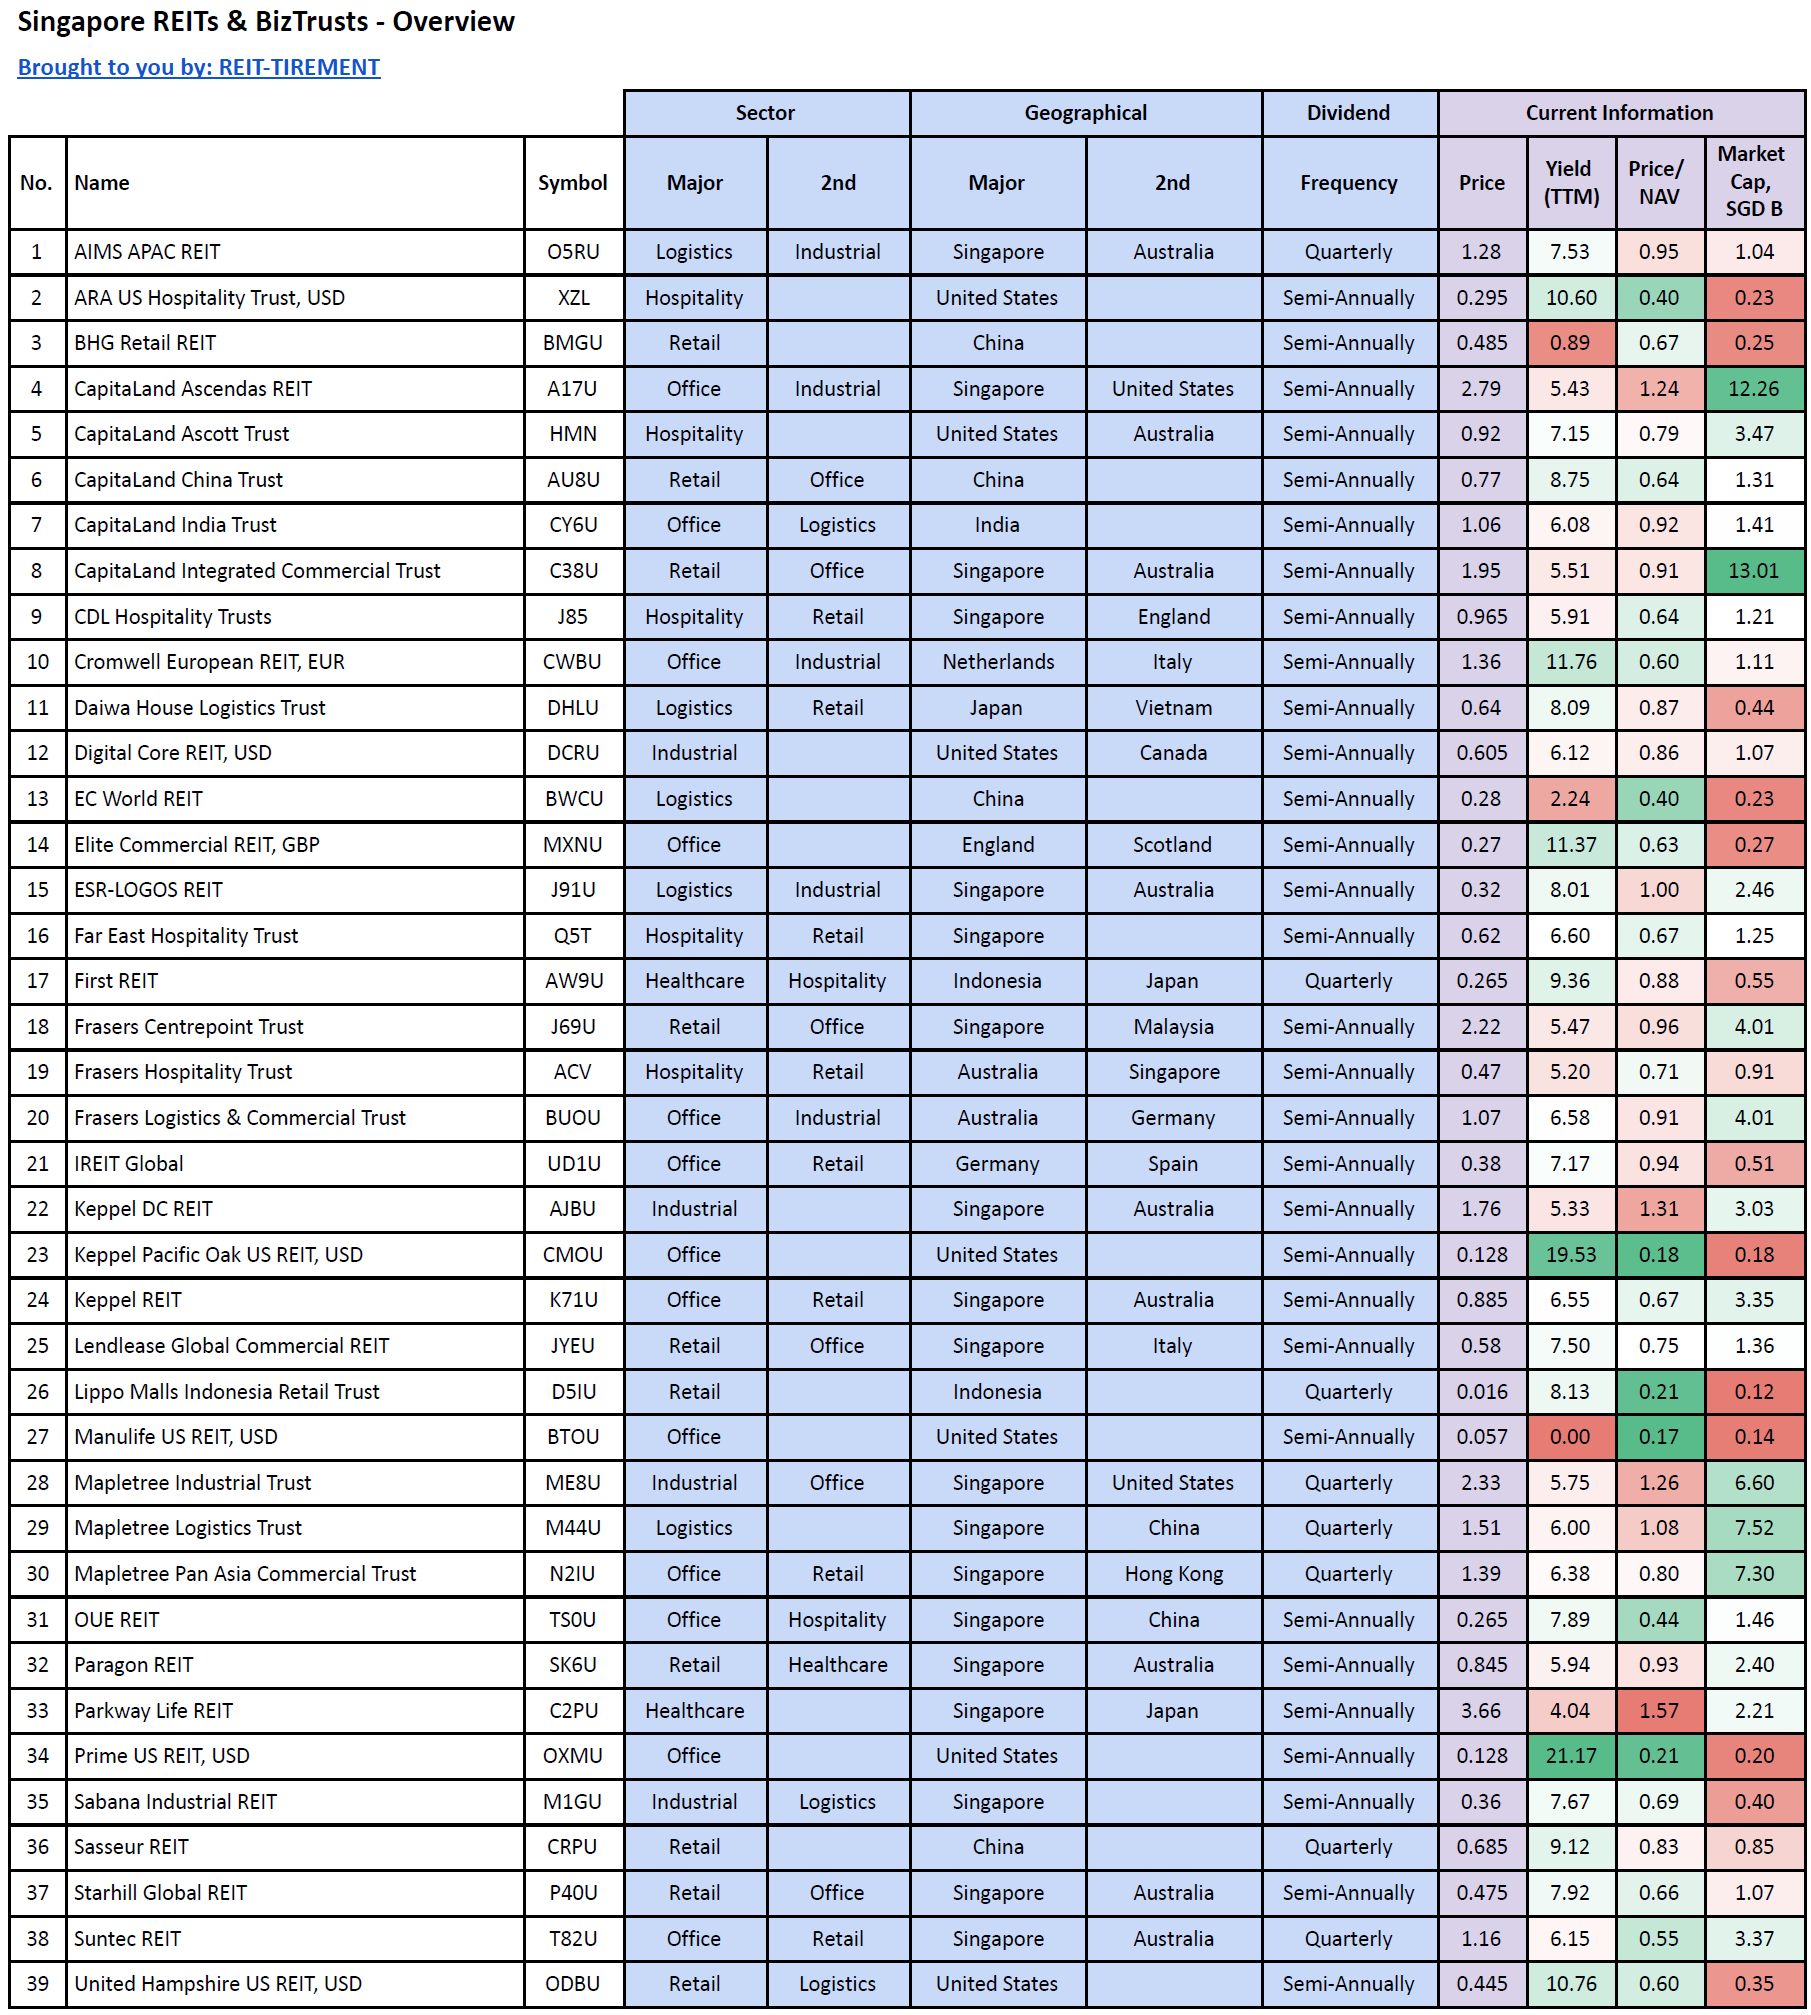
Basic Overview
** CapitaLand India Trust is a Business Trust
Key Statistics
| Items |
Average |
Median |
Min |
Max |
| Price/ NAV |
0.76 |
0.75 |
0.17 |
1.57 |
| Market Cap, S$ B |
2.38 |
1.21 |
0.12 |
13.01 |
| Dividend Yield - Retail |
7% |
7.71% |
0.89% |
10.76% |
| Dividend Yield - Office |
8.93% |
6.58% |
0% |
21.17% |
| Dividend Yield - Healthcare |
6.7% |
6.7% |
4.04% |
9.36% |
| Dividend Yield - Hospitality |
7.09% |
6.6% |
5.2% |
10.6% |
| Dividend Yield - Industrial |
6.22% |
5.93% |
5.33% |
7.67% |
| Dividend Yield - Logistics |
6.38% |
7.53% |
2.24% |
8.09% |
| Overall Dividend Yield |
7.48% |
6.6% |
0% |
21.17% |
- SREITs in foreign currencies are converted to SGD for Market Cap
** Dividend yields are based on REIT Major Sector
|
Highest Div. Yield (TTM) |
% |
Lowest Div. Yield (TTM) |
% |
| 1 |
Prime US REIT |
21.27% |
Manulife US REIT |
0% |
| 2 |
Keppel Pacific Oak US REIT |
19.53% |
BHG Retail REIT |
0.89% |
| 3 |
Cromwell European REIT |
11.76% |
EC World REIT |
2.24% |
| 4 |
Elite Commercial REIT |
11.37% |
Parkway Life REIT |
4.04% |
| 5 |
United Hampshire US REIT |
10.76% |
Frasers Hospitality Trust |
5.2% |
|
Highest P/NAV |
Time |
Lowest P/NAV |
Time |
| 1 |
Parkway Life REIT |
1.57 |
Manulife US REIT |
0.17 |
| 2 |
Keppel DC REIT |
1.31 |
Keppel Pacific Oak US REIT |
0.18 |
| 3 |
Mapletree Industrial Trust |
1.26 |
Lippo Malls Indonesia Retail Trust |
0.21 |
| 4 |
CapitaLand Ascendas REIT |
1.24 |
Prime US REIT |
0.21 |
| 5 |
Mapletree Logistics Trust |
1.08 |
ARA US Hospitality Trust |
0.4 |
...