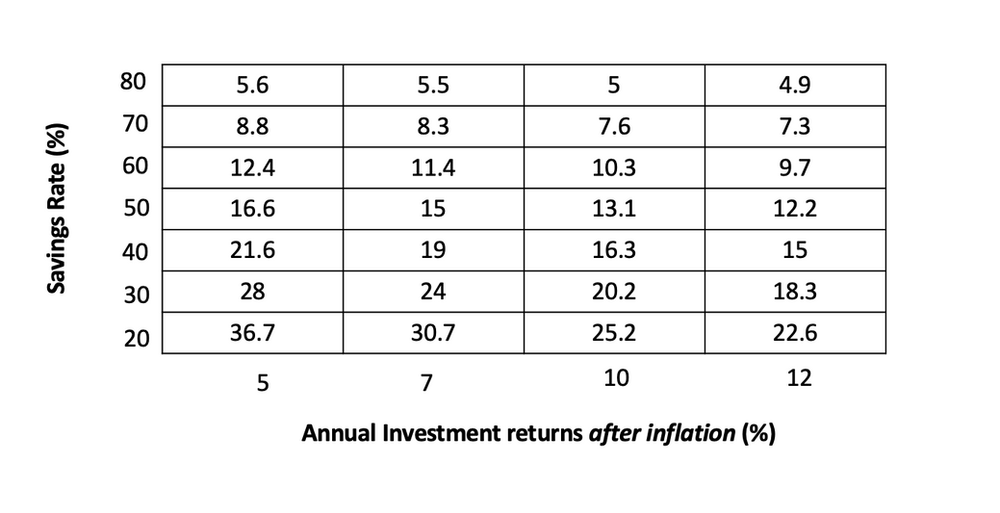
Hence, I thought of putting some simple data into a table for easy visualisation.
For context, here are a few assumptions about retirement. Retirement here represents having a portfolio which can generate 4% annual returns which can cover your annual expenses You are starting with 0 value in your portfolio now.
Here is the table.

The vertical axis represents the savings rate (%). I choose a range which fits the majority of the population. If you are saving 0%, you will never be able to retire. If you are saving 100%, you are already retired.
The horizontal axis represents the annual investment returns after inflation (%). Again, I choose a range which fits the majority of the population. Most retail investors should be having annual...