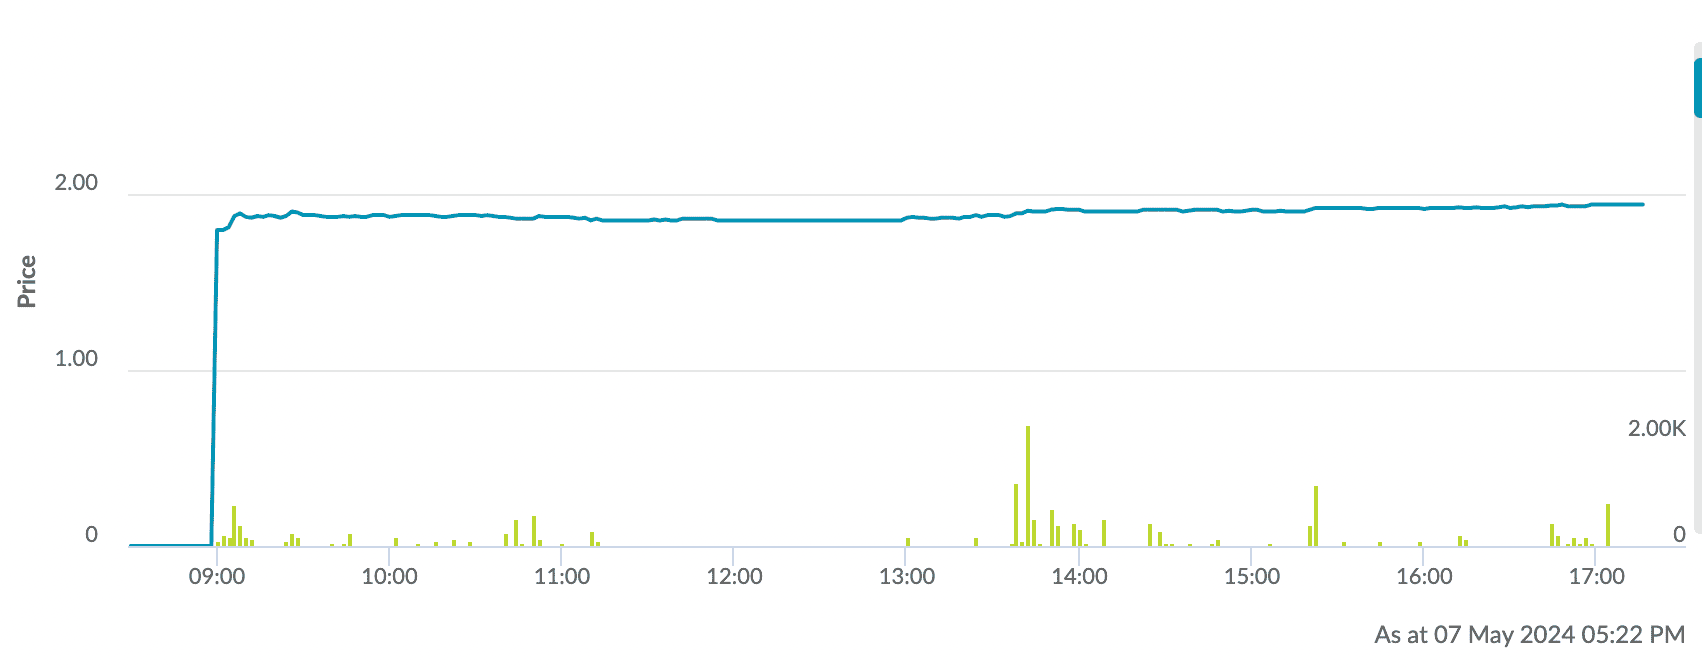
On Wednesday, NOL broke the critical resistance at $1.185 and closed at $1.19 with HIGH volume of 18.48 million shares traded.
A rising window occurred (where the top of the previous shadow is below the bottom of the current shadow). This usually implies a continuation of a bullish trend. There have been 3 rising windows in the last 50 candles–this makes the current rising window even more bullish.
RSI & MACD are bullish as RSI trend upwards.
Important Resistance of NOL: $1.285
Immediate Support of NOL: $1.185
Currently prices are supported by 20 days MA.
Prices broke out of the consolidation mode with high buying pressure today and this is a bullish signal.
However the long upper shadow affirms to great profit taking by investors and this rally may not last especially that it is already in its 2nd day. In fact, ...
...