Market Review and Trends
STI Analysis — the next peak and trough ? (V)
By ccloh Strategic Investor Zone  •  March 1, 2018
Continuous from STI Analysis -- the next peak and trough ? (IV) Like mentioned in previous analysis (refer above link), STI rebounded on the week started 12th February 2018 as according to what Elliott Wave predicted.  However, the pattern for this correction (corrective wave (ABC or WXY) for Minor degree or wave 2 for Intermediate degree) is yet to confirm.  At the moment the possibilities are :- 1. simple zigzag (A-B-C) 2. simple flat (W-X-Y) 3. triangle (A-B-C-D-E) 4. combination -- double three, double zigzag, etc (W-X-Y) IF we are treating this correction as a simple zigzag and the development so far (till 19th February 2018) somehow match this pattern very closely and resemble that of a classic textbook pattern.
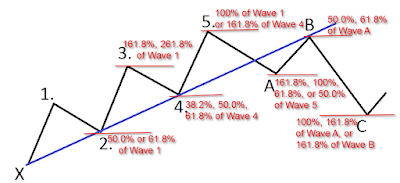
Above chart shows a classic textbook case for a corrective wave (A-B-C) with respect to Fibonacci ratio.  Now we look at STI chart from the beginning of Minor ...
...
Read the full article
By ccloh Strategic Investor Zone
Am a typical retail investor who started investing in stock market in 1993, the same length of period as SingTel was listed in SGX and ironically SingTel was my first vested stock. Back then was a passive investor and started to turn more active in stock market in 2006. A year later when I switched my engineering job to a finance related one, I became what commonly known as trader ( trade for living ) and at the same time also strongly believe in fundamental/value investing that is the way to growth wealth. In a way I classify myself as a "Strategic Investor". As a trader, I track market movement daily and as an value investor, I am always on the lookout for cheap bargain to hold for long term.
LEAVE A COMMENT
LEAVE A COMMENT

Your email address will not be published.

*

Your Email Address will not be published
*

Read More Articles
More from thefinance