


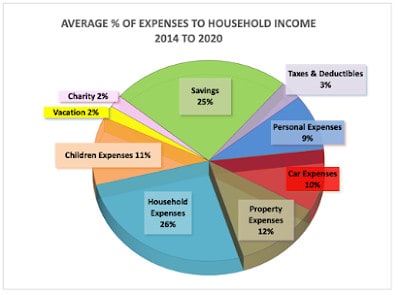
This is first time since I started blogging to publish data related to my household expenses. Below are data reflecting the percentage of My Household Expenses to My Take-Home Household Income. The data is compiled from year 2014 to c2020 (forecast), and below pie chart depicts the average data over the last seven years. 2020 data is accurate up to August and the rest of the quarter is estimated on a relatively conservative basis.
Gross Take-home household income – Me and wife are the two earners in a larger than usual household. The values here shown our Salaries excluding CPF contributions, AND ANY other incomes, such as property rental, professional writing, blogging income etc. All the rest of the expenses are taken as a percentage of the Gross Take-home household income. Taxes and Deductibles – This includes personal income taxes, property rental taxes, as well as...


