


As usual, we look at the price and volume movements of S-REITs and STI Components, week on week. This weekly post might come at a later hour from now on as I've recently secured employment, but I've also automated more of the data collation work, so hopefully I can get it before 9pm every Friday!
S-REITs
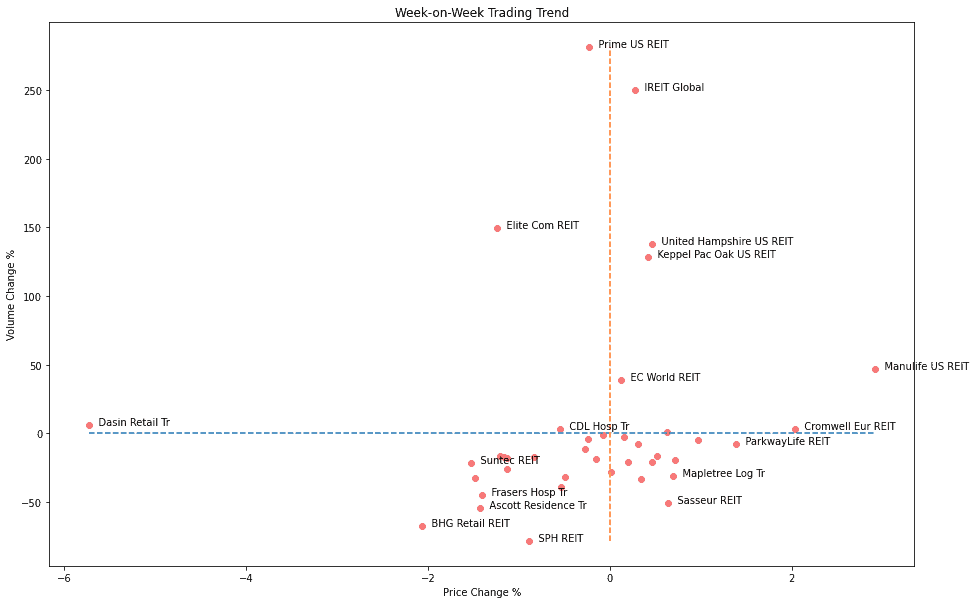
See my previous post for how the values are derived. This week, REITs saw a general decline in volume/interest, while the prices was directionless, with most counters evenly distributed around the [-2%, +2%] range.
(adsbygoogle = window.adsbygoogle || []).push({});
Sector Level:
Ranking: This table shows the top 3 gains and drops in week-on-week volume, which can be considered as a proxy for general investor interest.
Apart from the above indicator for general interest, the below table looks as weekly price changes, which can be considered...


