I wrote an article on how consumer spending could be used to understand the movement of the stock market. It was a lengthy piece explaining about RCD and RHS. RCD represents Invesco S&P500 Equal Weight Consumer Discretionary ETF. RHS represents Invesco S&P500 Equal Weight Consumer Consumer Staples ETF.
You may check out the article here to understand why these two ETFs are used to understand stock market movement.
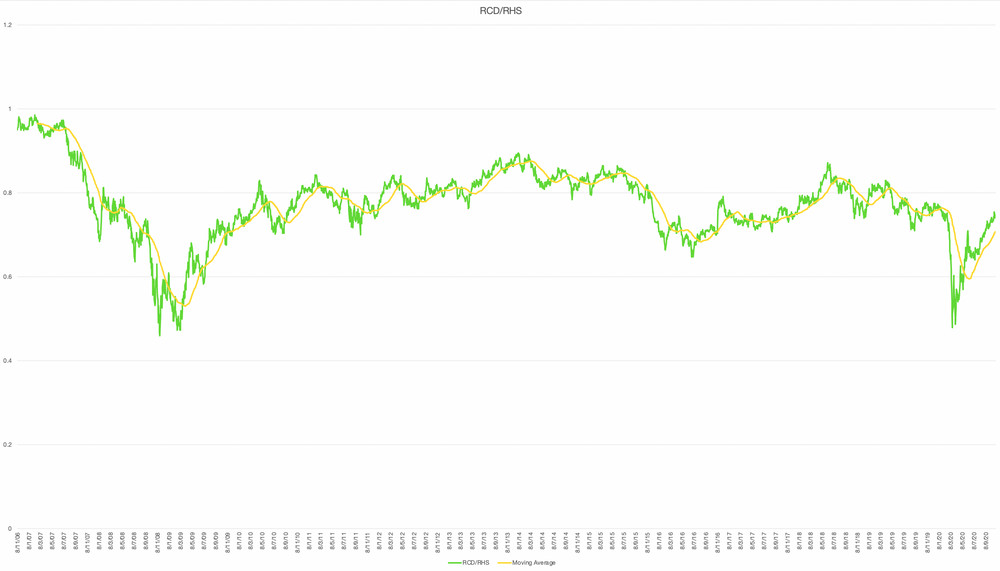
In the article, I explained how a graph comparing the ratio of RCD/RHS value against its 70-day moving average for the ratio of RCD/RHS could be used to anticipate market movement.
The green line represents the ratio of RCD/RHS, while the yellow line represents the 70-day moving average for the ratio of RCD/RHS.
In the past 14 years, market crashes usually happen when the ratio of RCD/RHS falls significantly below the moving average value as shown below.
Since May 2020, the ratio of RCD/RHS has never fallen significantly below the moving average....