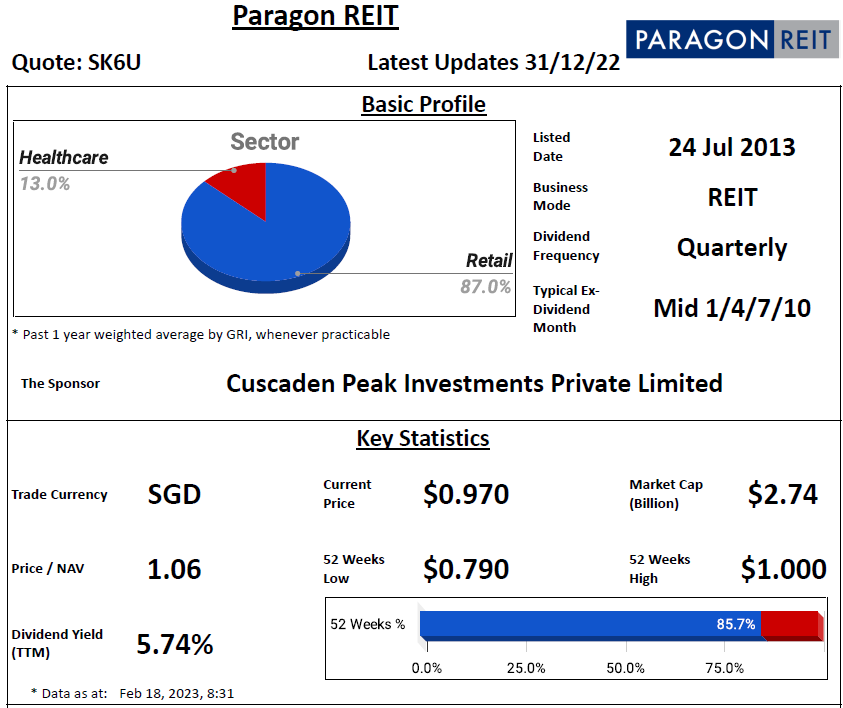
Basic Profile & Key Statistics
- Main Sector(s): Retail & Healthcare
- Country(s) with Assets: Singapore & Australia
- of Properties (exclude development/associate/fund): 5
Key Indicators
Performance Highlight
Gross revenue and NPI have improved yoy but distributable income declined yoy mainly due to higher finance costs. Distribution to unitholders and DPU remain similar yoy.
Rental Reversion
Rental reversion is at negative for both Singapore and Australia properties at -3.3% and -7% respectively.
Tenant Sales & Monthly Footfall
Tenant sales have recovered to above pre-COVID level for all the 4 malls above. For monthly footfall, Australian properties have recovered to pre-COVID levels, while Paragon has recovered to close to pre-COVID levels as well, however, there is still some gap for Clementi Mall.
Distribution Breakdown
- Distributable Income Breakdown:
- 5% from Operation
- 5% from Fees Payable/Paid in Units
- Distribution = 98% of Distributable Income
- Distribution to Perpetual Securities Holder = 7.7% of Distributable Income
Related Parties Shareholding
- REIT Sponsor's Shareholding: Above median for more than 20%
- REIT Manager's Shareholding: Above median for more than 20%
- Directors of REIT Manager's Shareholding: Below median for more than 20%
...