Continued from STI Analysis -- the next peak and trough ? (113)
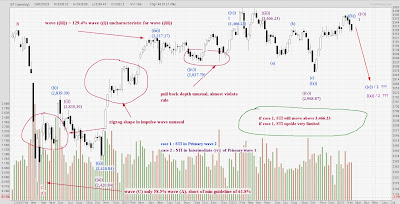
FTSE STI closed 3,282.30 for the week ended 24th February 2023, the third consecutive week of decline since hitting the peak of 3,408.19 on 30th January 2023.
Magenta -- STI Positive
From the chart doesn't look bright. The decline for the past 3 weeks could be the start of Intermediate wave ((c)) of Primary wave 2 or Intermediate wave ((a)) of Primary wave 1. The difference between these 2 cases is for the later, it will have more to drop. However, there is a very slight possibility that the dip for the past 3 weeks is just a minor pull back in the Minor degree meaning for both the cases short term wise, there is still upside (limited only).
Green -- STI Negative
For this scenario, pretty straight forward, the downside remains intact and given that it is still the Primary wave A of Cycle wave (C), there will be more downside to come and the worst still quite far away....