Continued from STI Analysis -- the next peak and trough ? (122)
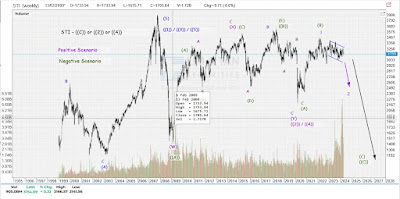
FTSE STI closed 3,154.69 on 17th Apr 2024, a rebound day after past few sessions of closing in the red.
Magenta -- STI Positive / Green -- STI Negative
The last analysis was done in Dec 2023 and the reason for past 3 months of no analysis was mainly due to not much changes in the EW pattern for both the STI Positive and STI Negative scenario. However, with the movement lately, there seem to be a clear EW pattern being defined.
Firstly, for the STI Positive scenario (Magenta color) as shown from the above chart, present EW count is in Primary wave 2. As for the STI Negative scenario (Green color), present EW count is in the Cycle wave (C) of the SuperCycle wave ((C)). Either of these 2 scenario are pointing to more downside going forward.
Secondly, zooming in to the movement since 2021, paying attention in particular to the low achieve in Oct 2022 till now....