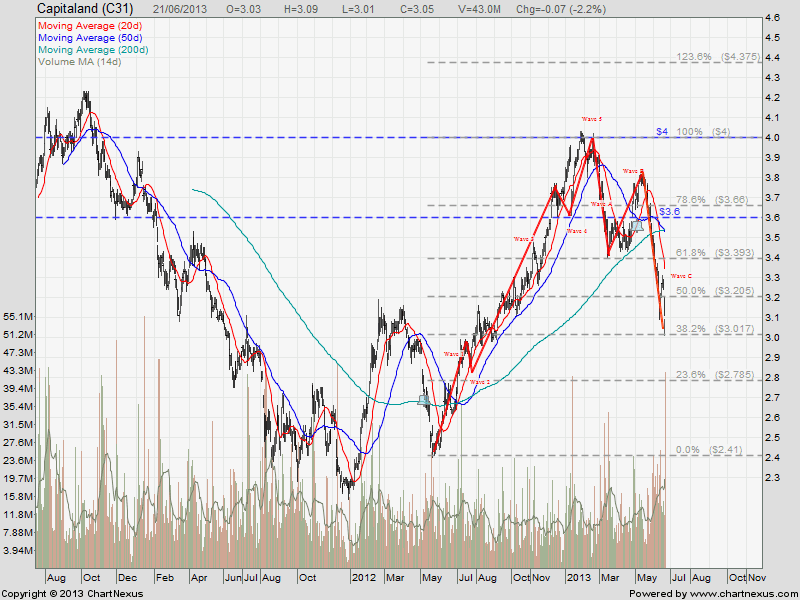
Capitaland is forming a very nice & complete Elliott Wave. Technically Capitaland is starting a down trend where “Lower Low, Lower High” pattern has been formed. Current price is trading below all 20D, 50D and 200D SMA whereby 20D & 50D have started Death Cross over 200D SMA.
Previous Stock Chart Pattern Analysis on CapitaLand.
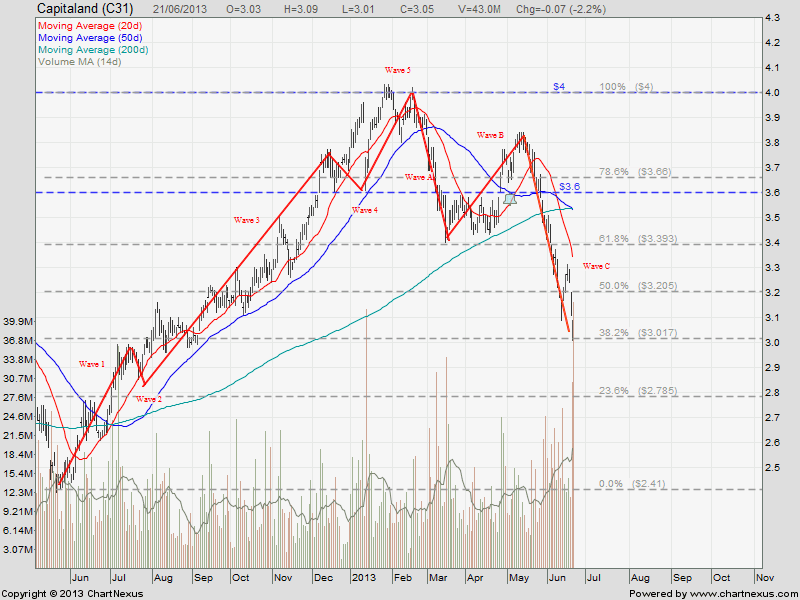
Expect more down side for Capitaland if look back at previous chart pattern. Previously Capitaland had shown Bearish Elliott Wave before. Will history repeat itself? Anyway it is not for me to guess. I will just trade base on what I see from the chart.