Benchmark SGX S-REIT 20 Index returned 6.2% in the YTD. Retail and Industrial REITs were the outperforming sub-segments
Key metrics from Oct-Dec quarter earnings suggest weaknesses in office property, while the Industrials and Retail segments remain relatively resilient.
Within the Index, Retail REITs were the best-performing sub-segment with a market capitalisation-weighted total return of 7.1%, followed by Industrials (+6.6%), Hospitality (+6.0%), Healthcare (+5.6%), Diversified (+5.2%) and Office (+4.6%).
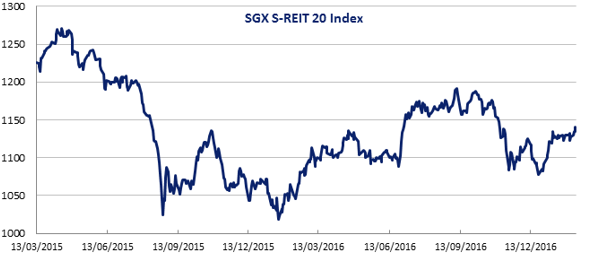
Total Returns of SGX S-REIT 20 Index
The benchmark SGX S-REIT 20 Index registered total returns of 6.2% in the year-to-date. This compares with the S&P Pan Asia Ex-Japan REIT Index, which generated a total return of 1.9% in Singapore dollar terms in the same period. Within the SGX S-REIT 20 Index, Retail REITs were the best-performing sub-segment, posting a market capitalisation-weighted total return of 7.1%, followed by Industrials (+6.6%), Hospitality (+6.0%), Healthcare (+5.6%), Diversified (+5.2%) and Office (+4.6%).
Designed to provide a performance measure of Singapore’s biggest and most actively traded REITs, the SGX S-REIT 20 Index was established in 2015. The Index is a free-float, market capitalisation-weighted index that measures the performance of stocks operating within the REIT Sector.
Key Reported Metrics for S-REITs
S-REITs have completed their earnings reports for the October-December 2016 quarter. Some key reported metrics commentary are listed below.
Occupancy rates – Most Industrials REITs within the Index saw occupancy rates increasing slightly, with the exception of Mapletree Industrial Trust. Retail REITs mostly sustained their occupancy rates, while Office REITs mostly saw declining trends.
Rental reversions – Industrial and Retail REITs mostly enjoyed positive rental reversions while Office REITs saw the opposite.
Rental rates – Rental rates for Industrial REITs were mixed as Business parks rentals increased by low-single digit on a YoY basis while factories and warehouses rentals declined. Retail rentals were also mostly down on both a QoQ and YoY basis. Grade A Office rentals declined double-digit YoY while Grade B rentals also fell.
Revenue Per Available Room (RevPAR) – Hospitality REITs saw declining RevPAR, which were mostly attributed to new hotel supply and softening corporate travel due to global economic weakness.
Outlook – The common theme from outlook commentaries in the earnings releases was that the business environment in Singapore remains challenging due to global uncertainties. Increased supply in Industrials, Office and hotel rooms were also cited as potential headwinds for occupancy and rental rates.
For a detailed summary of the December quarter earnings of five Industrial REITs published 25 January, click
here.
The table below details the constituents of the SGX S-REIT 20 Index, sorted by market capitalisation. Note that clicking on a trust name will bring you to its profile page on StockFacts.
| Name |
SGX Code |
Market Cap S$M |
Total Return YTD % |
Total Return 1 Yr % |
P/E |
Div Ind Yld % |
P/B |
GICS SubInd Name |
| CapitaLand Mall Trust |
C38U |
6,980 |
6.1 |
-0.5 |
14.9 |
5.8 |
1.0 |
Retail REITs |
| Ascendas REIT |
A17U |
6,975 |
9.2 |
9.0 |
17.4 |
6.4 |
1.2 |
Industrial REITs |
| CapitaLand Commercial Trust |
C61U |
4,564 |
7.3 |
21.0 |
17.5 |
6.0 |
0.9 |
Office REITs |
| Suntec REIT |
T82U |
4,402 |
6.4 |
17.2 |
17.8 |
6.0 |
0.8 |
Diversified REITs |
| Mapletree Commercial Trust |
N2IU |
4,362 |
10.6 |
19.5 |
10.7 |
5.5 |
1.1 |
Retail REITs |
| Keppel REIT |
K71U |
3,377 |
1.5 |
17.1 |
15.9 |
5.8 |
0.7 |
Office REITs |
| Mapletree Industrial Trust |
ME8U |
3,001 |
3.0 |
15.5 |
10.7 |
6.8 |
1.2 |
Industrial REITs |
| Mapletree GCC Trust |
RW0U |
2,731 |
3.2 |
24.1 |
6.9 |
7.3 |
0.8 |
Diversified REITs |
| Mapletree Logistics Trust |
M44U |
2,638 |
5.3 |
18.6 |
14.6 |
7.1 |
1.0 |
Industrial REITs |
| SPH REIT |
SK6U |
2,489 |
4.0 |
11.0 |
19.2 |
5.5 |
1.0 |
Retail REITs |
| Ascott Residence Trust |
A68U |
1,893 |
5.2 |
8.5 |
15.1 |
7.7 |
0.9 |
Residential REITs |
| Frasers Centrepoint Trust |
J69U |
1,867 |
8.4 |
11.0 |
15.3 |
5.7 |
1.1 |
Retail REITs |
| Starhill Global REIT |
P40U |
1,636 |
3.1 |
6.7 |
10.3 |
6.8 |
0.8 |
Retail REITs |
| Parkway Life REIT |
C2PU |
1,488 |
5.6 |
19.6 |
16.2 |
5.0 |
1.4 |
Health Care REITs |
| Frasers Logistics & Industrial Trust |
BUOU |
1,370 |
3.8 |
N/A |
N/A |
1.9 |
1.0 |
Industrial REITs |
| CDL Hospitality Trusts |
J85 |
1,365 |
6.7 |
16.1 |
27.5 |
8.1 |
0.9 |
Hotel & Resort REITs |
| CapitaLand Retail China Trust |
AU8U |
1,287 |
11.7 |
14.8 |
11.9 |
6.4 |
0.9 |
Retail REITs |
| OUE Hospitality Trust |
SK7 |
1,224 |
5.1 |
7.1 |
51.5 |
8.1 |
0.9 |
Hotel & Resort REITs |
| Lippo Malls Indonesia Retail Trust |
D5IU |
1,094 |
5.4 |
40.8 |
37.9 |
8.7 |
1.0 |
Retail REITs |
| Frasers Commercial Trust |
ND8U |
1,014 |
2.8 |
16.0 |
13.9 |
7.9 |
0.8 |
Office REITs |
| Average |
|
|
5.7 |
15.4 |
18.2 |
6.4 |
1.0 |
|
Sub-segments in SGX S-REIT 20 Index
The SGX S-REIT 20 Index is diversified across types of property assets. The Global Industry Classification Standard (GICS®) is applied by SGX StockFacts to help define the different sectoral focus within the REIT sector. Retail REITs were the best-performing sub-segments with a market capitalisation-weighted total return of 7.1%, followed by Industrials (+6.6%), Hospitality (+6.0%), Healthcare (+5.6%), Diversified (+5.2%) and Office (+4.6%). Highlighted in the table below are some key drivers of the main sub-segments:
| Sub-segment |
Sub-sector Weight % |
Total Return YTD % |
Key Drivers |
| Retail REITs |
29.2 |
7.1% |
Tourist arrival, population growth and national average wage
Retail property price, rental and occupancy indicators can found on the URA website (link)
|
| Industrial REITs |
25.8 |
6.6% |
Country economy performance (largely GDP), business sentiment
Industrial property price, rental, vacancy and supply pipeline indicators can be found on JTC website (link)
|
| Office REITs |
18.0 |
4.6% |
Grade-A office building PSF, GDP, employment figures
Office Rental Index, occupancy and supply indicators can be found on URA website (link)
|
| Hospitality REITs |
4.2 |
6.0% |
Tourist arrival, hotel rooms supply and vacancy, revenue per room, MICE trends
Statistics on the tourism sector can be found on STB’s website (link)
|
Source: SGX & Bloomberg (data as of 8 February 2017)
Constituents of the SGX S-REIT 20 Index are also diversified geographically in terms of their assets. More than half the trusts have property assets located outside Singapore, mostly around Asia. This includes countries such as China, Hong Kong, Vietnam, Japan, Indonesia, South Korea, Philippines and Malaysia.
SGX My Gateway
SGX’s investor education portal with market, product and investment information and events. Sign up now at
sgx.com/mygateway to receive our investment updates and economic calendar.
This document is not intended for distribution to, or for use by or to be acted on by any person or entity located in any jurisdiction where such distribution, use or action would be contrary to applicable laws or regulations or would subject SGX to any registration or licensing requirement. This document is not an offer or solicitation to buy or sell, nor financial advice or recommendation for any investment product. This document has been published for general circulation only. It does not address the specific investment objectives, financial situation or particular needs of any person. Advice should be sought from a financial adviser regarding the suitability of any investment product before investing or adopting any investment strategies. Investment products are subject to significant investment risks, including the possible loss of the principal amount invested. Past performance of investment products is not indicative of their future performance. While SGX and its affiliates have taken reasonable care to ensure the accuracy and completeness of the information provided, they will not be liable for any loss or damage of any kind (whether direct, indirect or consequential losses or other economic loss of any kind) suffered due to any omission, error, inaccuracy, incompleteness, or otherwise, any reliance on such information. Neither SGX nor any of its affiliates shall be liable for the content of information provided by third parties. SGX and its affiliates may deal in investment products in the usual course of their business, and may be on the opposite side of any trades. SGX is an exempt financial adviser under the Financial Advisers Act (Cap. 110) of Singapore. The information in this document is subject to change without notice.


