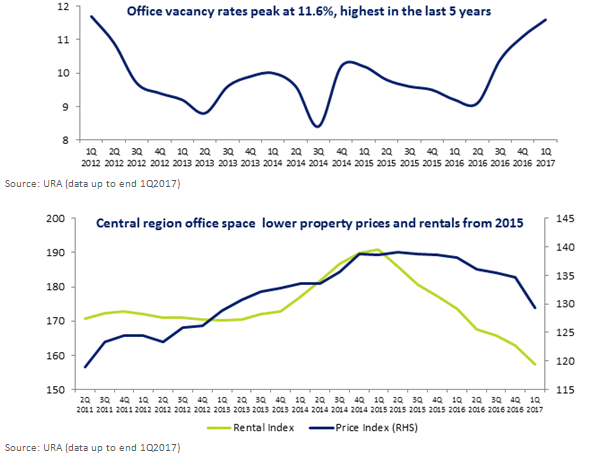
1Q17 office space vacancy rates peaked at 11.6%, highest in five years. Office rental rates continue to decline and Grade A office rents stabilising QoQ, indicating signs of stabilisation in office rental rates.
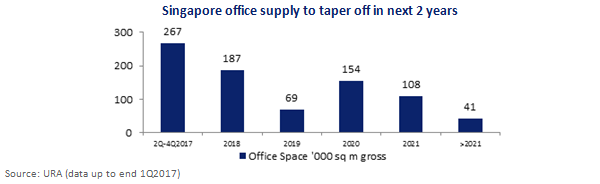
Office space supply is expected to peak in 2017 and taper off in the next few years. CBRE Research believes that sentiment has swung from pessimism to optimism as investors forecast a period of relatively modest supply over the next few years.
SGX lists six Office REITs (GICS®) with a combined market capitalisation of S$12.8 billion. These 6 trusts have generated a market cap weighted average total return of 16.9% in the YTD and have an average dividend yield of 5.7%.
Real Estate Sector Sub-Segment: Office Property Market
Vacancy rates highest since 1Q12 and rental rates continue to fall
Recent data by the Urban Redevelopment Authority (URA) shows office space vacancy rates in 1Q17 peaking at 11.6%, the highest level in the last five years (1Q12 vacancy rates at 11.7%). Office rents have also been on a steady decline as the Singapore Office Rental Index continues to fall by 3.4% to 157.3 points in 1Q17 (9 quarters of continuous rental decline). On a positive note, CBRE Research indicates signs of stabilisation in office rental rates as average Grade A office rents stabilise at $8.95 per sq ft and were flat QoQ. DBS Vickers Securities believes that the office property market is approaching the cyclical lows as investors and office landlords have turned more positive on office outlook.
 Office space supply to peak in 2017 and sentiments turn positive
URA data shows that office space supply is expected to peak in 2017 (largely due to Marina One and UIC Building for example) and suggests supply is tapering off in the next few years. The total office space supply for 1Q17 at 5.1% higher from previous quarter with about 826,000 sq m gross floor area of office space. DBS Vickers Securities expects supply to ease in the next few years after 2017 as the new wave comes around 2021 when Golden Shoe (c.800,000 sq ft) and Central Boulevard (c. 1.1million sq ft) are completed.
 Primary transactions picking up year-to-date
According to CBRE Research, office market deals are picking up with S$3.39 billion worth of office deals transacted in the first four months of 2017. Recent deals include the sale of Asia Square Tower 1 to Qatar Investment Authority for S$3.4 billion and potentially Asia Square Tower 2 by BlackRock and CapitaLand. CBRE Research also believes that sentiment has swung from pessimism to optimism as investors forecast a period of relatively modest supply over the next few years.
For more, please refer to the
SGX Real Estate sector presentation.
SGX’s Cluster of Office REITs
SGX lists six Office REITs (GICS®) with a combined market capitalisation of S$12.8 billion. These 6 trusts have generated a market cap weighted average total return of 16.9% in the year-to-date and have an average dividend yield of 5.7%. The five best performers in the year-to-date are CapitaLand Commercial Trust (+20.2%), Frasers Commercial Trust (+17.1%), Keppel REIT (+16.0%), Manulife US REIT (+13.7%) and IREIT Global (+12.5%).
The table below details the Office REITs (GICS®) sorted by market capitalisation:
| Name |
SGX Code |
Market Cap S$M |
Price S$ |
Total Return YTD % |
Total Return 1 Yr % |
P/B |
P/B 5 Yr Avg |
Gearing % |
Dvd Ind Yld % |
| CapitaLand Commercial Trust |
C61U |
5,280 |
1.730 |
20.2 |
16.6 |
0.9 |
0.9 |
28.5 |
5.3 |
| Keppel REIT |
K71U |
3,839 |
1.150 |
16.0 |
12.8 |
0.8 |
0.8 |
32.5 |
2.7 |
| Frasers Commercial Trust |
ND8U |
1,139 |
1.420 |
17.1 |
15.0 |
0.9 |
0.8 |
35.8 |
7.0 |
| OUE Commercial REIT |
TS0U |
1,108 |
0.720 |
8.9 |
15.8 |
0.8 |
0.8 |
34.1 |
8.9 |
| Manulife US REIT |
BTOU |
917 |
1.260 |
13.7 |
17.2 |
1.1 |
N/A |
33.6 |
2.3 |
| IREIT Global |
UD1U |
480 |
0.770 |
12.4 |
12.5 |
1.2 |
1.1 |
41.9 |
8.0 |
| Average |
|
|
|
14.7 |
15.0 |
1.0 |
0.9 |
34.4 |
5.7 |
| Market Cap Weighted Average |
|
|
16.9 |
15.1 |
0.9 |
0.8 |
31.7 |
|
Source: SGX, Bloomberg & SGX StockFacts (data as of 19 July 2017)
Of the six trusts, Keppel REIT and CapitaLand Commercial Trust have reported recent earnings this week. Some key highlights include:
Keppel REIT
- Distribution per Unit (DPU) of 1.42 cents declared for 2Q 2017, bringing 1H 2017 DPU to 2.87 cents and an annualised distribution yield of 5.0%.
- Distribution income (DI) for 1H 2017 was at S$95.5 million, lower YoY mainly due to absence of income from 77 King Street in Sydney which was divested in Jan 2016, lower one-off income in 1H 2017, lower income contribution from Bugis Junction Towers and the absence of other gains distribution.
- Portfolio committed occupancy rate of 99.8% as at end June 2017. Tenant retention rate was at 85% for 1H2017. Click here to read more.
CapitaLand Commercial Trust
- DPU of 2.27 cents declared for 2Q 2017, bringing 1H 2017 DPU to 4.59 cents, 4.6% higher YoY and an annualised distribution yield of 5.5%.
- DI for 2Q 2017 was at S$69.5 million, 6.7% higher YoY. Positive results are due to CapitaGreen’s better performance and higher contribution to overall gross revenue and net property income.
- Portfolio committed occupancy rate of 97.6% as at end Jun 2017 vs. the core CBD market occupancy rate of 94.1%. Click here to read more.
Previous Market Updates on the Real Estate Sector
- 6 July 2017: SGX Real Estate Index Returned 19.5% YTD on Positive Indicators – Click here
- 13 July 2017: Singapore Private Property Market Shows Signs of Stabilising – Click here
- 14 July 2017: Green Shoots Emerge Despite Challenging Industrial Property Market – Click here
SGX My Gateway
SGX’s investor education portal with market, product and investment information and events. Sign up now at
sgx.com/mygateway to receive our investment updates and economic calendar.
This document is not intended for distribution to, or for use by or to be acted on by any person or entity located in any jurisdiction where such distribution, use or action would be contrary to applicable laws or regulations or would subject Singapore Exchange Limited (“SGX”) to any registration or licensing requirement. This document is not an offer or solicitation to buy or sell, nor financial advice or recommendation for any investment product. This document is for general circulation only. It does not address the specific investment objectives, financial situation or particular needs of any person. Advice should be sought from a financial adviser regarding the suitability of any investment product before investing or adopting any investment strategies. Use of and/or reliance on this document is entirely at the reader’s own risk. Further information on this investment product may be obtained from www.sgx.com. Investment products are subject to significant investment risks, including the possible loss of the principal amount invested. Past performance of investment products is not indicative of their future performance. Examples provided are for illustrative purposes only. While each of SGX and its affiliates (collectively, the “SGX Group Companies”) have taken reasonable care to ensure the accuracy and completeness of the information provided, each of the SGX Group Companies disclaims any and all guarantees, representations and warranties, expressed or implied, in relation to this document and shall not be responsible or liable (whether under contract, tort (including negligence) or otherwise) for any loss or damage of any kind (whether direct, indirect or consequential losses or other economic loss of any kind, including without limitation loss of profit, loss of reputation and loss of opportunity) suffered or incurred by any person due to any omission, error, inaccuracy, incompleteness, or otherwise, any reliance on such information, or arising from and/or in connection with this document. The information in this document may have been obtained via third party sources and which have not been independently verified by any SGX Group Company. No SGX Group Company endorses or shall be liable for the content of information provided by third parties. The SGX Group Companies may deal in investment products in the usual course of their business, and may be on the opposite side of any trades. SGX is an exempt financial adviser under the Financial Advisers Act (Cap. 110) of Singapore. The information in this document is subject to change without notice. This document shall not be reproduced, republished, uploaded, linked, posted, transmitted, adapted, copied, translated, modified, edited or otherwise displayed or distributed in any manner without SGX’s prior written consent.


