Following average price declines of 2.2% in 2016, the five Real Estate Management and Development constituents of the Straits Times Index (STI) have averaged a 38.4% price gain in the 2017 YTD.
The Urban Redevelopment Authority (URA) recently reported prices of private residential properties officially increased by 0.7% in 3Q17, compared with the 0.1% decline in 2Q17. This was the first quarterly gain for this property price index since 3Q13.
Real estate services provider, APAC Realty, which operates in Singapore under the ERA brand, debuted on the Mainboard on 28 Sep. From its IPO price at S$0.660, the stock has generated a 37.1% gain, closing at S$0.905 on 1 Nov.
Following average price declines of 2.2% in 2016, the five constituents of the Straits Times Index (STI) that represent the Real Estate Management and Development Sector have averaged a 38.4% price gain in the 2017 year-to-date. Hongkong Land Holdings and CapitaLand have gained 9.5% and 22.5% respectively, whilst Global Logistic Properties, City Developments and UOL Group have all posted price gains above 50%.
The gains of these stocks have coincided with global institutions rotating into cyclical plays over the first 10 months of the year, in addition to signs of stabilisation in the local property market.
Average Price Performances of STI’s Real Estate Management & Development Stocks
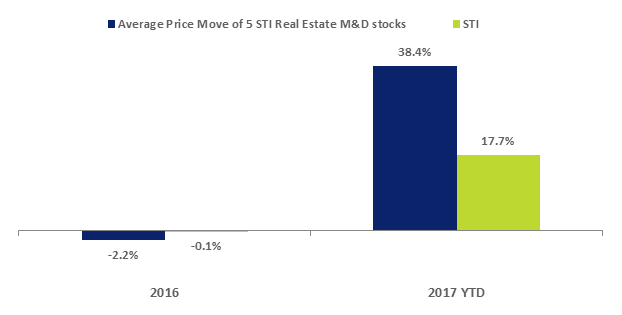
Source: SGX StockFacts (Data as of 1 November 2017)
The performances also mean that the Real Estate Management & Development segment of stocks has been the strongest STI segment for the 2017 year thus far. For the broader market, the Real Estate Management & Development Sector was the third best performing Sector after the Materials and Information Technology Sectors.
The longer term trend of the Real Estate Management & Development Sector is illustrated in the chart below as gauged by the SGX Real Estate Developers & Operators Index. From the February 2016 low, the Index has gained 58.2%.
SGX Real Estate Developers & Operators Index
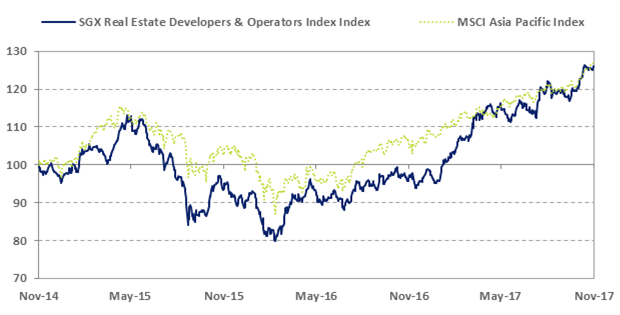
Source: Bloomberg (data as of 1 November 2017)
Similar Industry Moves
The 24 stocks of the SGX Real Estate Developers & Operators Index have averaged a 24.1% price gain in the year to date. Other Industries that share cyclical similarities to Real Estate Development and Management have also performed comparative well. For instance:
- The 20 largest capitalised trusts of the Real Estate Investment Trust (REIT) Sector have a combined market capitalisation of S$67.4 billion and averaged a 23.1% price gain over the period. The 20 trusts maintain an average indicative distribution yield of 5.5%.
- The 20 largest capitalised stocks of the Hotels, Restaurant and Leisure Industry have a combined market capitalisation of S$42.3 billion and averaged a 25.4% price gain over the period. This Industry is a sub-sector of the Consumer Discretionary Sector
- The 20 largest capitalised stocks of the Construction & Engineering Industry have a combined market capitalisation of $7.0 billion and averaged a 37.7% price gain over the period. This Industry is a sub-sector of the Consumer Discretionary Sector.
Policy Measures & Signs of Stability
Back in March, the Singapore government announced calibrated adjustments to existing property cooling measures. Property cooling measures imposed by the government over recent years such as stamp duties and loan restrictions have helped stabilise increasing demand. Examples of major policy measures included the raising of seller stamp duties (SSD) and additional buyer stamp duties (ABSD) in 2011, and further ABSD changes and the introduction of a total debt servicing ratio (TDSR) in 2013.
MAS Managing Director Ravi Menon noted mid-year that private home sales had seen signs of stabilising in Singapore and that property prices should be aligned with the broader income trends of the local economy. Mr Menon further noted that the local property market had substantially stabilised over the last three years with underlying demand for private homes remaining firm amidst a low interest rate environment. Mr Menon also stated that the cooling measures remain necessary and it was not yet time to ease them. The full speech from 29 June can be found
here.
URA PPI Registers First Quarterly Increase Since 3Q13
Prices of private residential properties officially increased by 0.7% in 3Q17, compared with the 0.1% decline in 2Q17. This was the first quarterly gain for this Urban Redevelopment Authority (URA) property price index since 3Q13. In its detailed quarterly report (click
here), URA also noted that rentals of private residential properties remained unchanged, compared with the 0.2% decline in the previous quarter.
APAC Realty up 37% from IPO Price
APAC Realty is a pure-play Real Estate Broker that was listed on the SGX Mainboard on 28 September. The company is a real estate services provider which operates in Singapore under the ERA brand, and has two main business segments.
The company provides real estate brokerage services, which contributed to 97% of its revenue in FY16. The remaining 3% of revenue was segmented to franchise arrangements, training, valuation and other ancillary services. From its IPO price at S$0.660, APAC Realty has generated a price return of +37.1% closing at S$0.905 on 1 November.
In its IPO Prospectus (click
here), APAC Realty detailed Cushman & Wakefield Research, which proposed that Singapore’s primary residential market transaction volume is projected to grow at a 5.6% CAGR from 2017 to 2021, and that long-term prospects of the Singapore residential market remain positive. For more details on the listing click
here.
Quarterly Report Season has Begun
Almost a handful of the Real Estate Developers & Operators Index constituents have reported earnings for the September quarter, including two of the 10 biggest constituents of the Index.
GuocoLand reported its 1QFY18 results in October (click
here) with the Group’s revenue increasing by 79% YoY to approximately S$362 million. In line with the higher revenue, gross profit increased by 41% YoY to S$60.4 million. The better performance was mainly contributed by higher sales and progressive revenue recognition from Singapore’s residential projects.
Wing Tai Holdings also reported its 1QFY18 results in October (click
here). For the three months ended 30 September the Group recorded a total revenue of S$67.1 million, representing a 4% YoY decrease from the S$70.2 million revenue recorded in its 1QFY17. The Group’s operating profit increased by 509% YoY to S$14.0 million for its 1QFY18, mainly due to the contributions from Le Nouvel Ardmore and Le Nouvel KLCC as well as a gain on the disposal relating to the Huai Hai project in Shanghai.
CapitaLand is reporting its 3QFY17 earnings before the market open on 8 November, followed by City Developments and UOL Group reporting on 9 November.
SGX Real Estate Developers & Operators Index Constituents
The table below details the 24 constituents of the index, sorted by market capitalisation. With the average year-to-date price gains of 24.1%, the average price-to-book (P/B) ratio of the 20 stocks is 0.9x, above the five year average of 0.8x. Just over half the 24 stocks currently maintain a P/B ratio which is more than 0.1x above their five year P/B average.
Click on each stock to visit its profile page on SGX StockFacts.
| Name |
SGX Code |
Market Cap S$M |
Last Price* |
Price Change 2016 % |
Price Change YTD % |
P/B (x) |
Dvd Ind Yld % |
| Hongkong Land Hldgs |
H78 |
23,597 |
7.370 |
-7.7 |
9.5 |
0.5 |
2.6 |
| CapitaLand |
C31 |
15,714 |
3.700 |
-9.9 |
22.5 |
0.9 |
2.7 |
| Global Logistic Properties |
MC0 |
15,595 |
3.320 |
2.3 |
50.9 |
1.3 |
1.8 |
| City Developments |
C09 |
11,785 |
12.960 |
8.2 |
56.5 |
1.3 |
0.6 |
| UOL Group |
U14 |
7,683 |
9.130 |
-4.0 |
52.4 |
0.9 |
1.6 |
| Yanlord Land Group |
Z25 |
3,525 |
1.825 |
31.3 |
38.3 |
0.8 |
2.3 |
| GuocoLand |
F17 |
2,816 |
2.380 |
-0.3 |
32.2 |
0.7 |
2.9 |
| Wheelock Properties |
M35 |
2,441 |
2.040 |
1.4 |
37.8 |
0.8 |
2.9 |
| Wing Tai Hldgs |
W05 |
1,874 |
2.420 |
-9.4 |
52.2 |
0.6 |
1.2 |
| Bukit Sembawang Estates |
B61 |
1,665 |
6.430 |
-0.4 |
43.5 |
1.3 |
0.6 |
| Ho Bee Land |
H13 |
1,718 |
2.580 |
0.5 |
27.1 |
0.6 |
2.3 |
| GSH Corp |
BDX |
1,068 |
0.545 |
104.0 |
6.9 |
2.6 |
N/A |
| Yoma Strategic Hldgs |
Z59 |
1,017 |
0.585 |
25.8 |
0.0 |
1.5 |
0.4 |
| Hong Fok Corp |
H30 |
788 |
0.905 |
-3.7 |
43.7 |
0.5 |
1.1 |
| Far East Orchard |
O10 |
661 |
1.555 |
-1.3 |
4.4 |
0.5 |
3.9 |
| Rowsley |
A50 |
630 |
0.133 |
-32.4 |
8.1 |
1.5 |
N/A |
| Tuan Sing Hldgs |
T24 |
510 |
0.430 |
-12.3 |
50.9 |
0.6 |
1.4 |
| Centurion Corp |
OU8 |
451 |
0.560 |
-15.4 |
69.7 |
1.0 |
3.6 |
| Ying Li International Real Estate |
5DM |
371 |
0.145 |
-10.2 |
-2.7 |
0.4 |
N/A |
| Sing Hldgs |
5IC |
198 |
0.495 |
-6.1 |
59.7 |
0.8 |
2.0 |
| Aspen Group Hldgs |
1F3 |
191 |
0.220 |
N/A |
-4.3 |
N/A |
N/A |
| LHN |
41O |
66 |
0.182 |
41.7 |
-7.6 |
0.9 |
2.5 |
| HLH Group |
H27 |
37 |
0.006 |
16.7 |
-40.0 |
0.3 |
N/A |
| Boldtek Hldgs |
5VI |
34 |
0.200 |
0.0 |
-32.2 |
N/A |
N/A |
| Average |
|
|
|
5.2 |
24.1 |
0.9 |
2.0 |
Source: Bloomberg & SGX StockFacts (data as of 1 November 2017). *Last price of companies are denoted in their respective trading currencies. SGD equivalents are shown for the other fields in the table.
This document is not intended for distribution to, or for use by or to be acted on by any person or entity located in any jurisdiction where such distribution, use or action would be contrary to applicable laws or regulations or would subject Singapore Exchange Limited (“SGX”) to any registration or licensing requirement. This document is not an offer or solicitation to buy or sell, nor financial advice or recommendation for any investment product. This document is for general circulation only. It does not address the specific investment objectives, financial situation or particular needs of any person. Advice should be sought from a financial adviser regarding the suitability of any investment product before investing or adopting any investment strategies. Use of and/or reliance on this document is entirely at the reader’s own risk. Further information on this investment product may be obtained from www.sgx.com. Investment products are subject to significant investment risks, including the possible loss of the principal amount invested. Past performance of investment products is not indicative of their future performance. Examples provided are for illustrative purposes only. While each of SGX and its affiliates (collectively, the “SGX Group Companies”) have taken reasonable care to ensure the accuracy and completeness of the information provided, each of the SGX Group Companies disclaims any and all guarantees, representations and warranties, expressed or implied, in relation to this document and shall not be responsible or liable (whether under contract, tort (including negligence) or otherwise) for any loss or damage of any kind (whether direct, indirect or consequential losses or other economic loss of any kind, including without limitation loss of profit, loss of reputation and loss of opportunity) suffered or incurred by any person due to any omission, error, inaccuracy, incompleteness, or otherwise, any reliance on such information, or arising from and/or in connection with this document. The information in this document may have been obtained via third party sources and which have not been independently verified by any SGX Group Company. No SGX Group Company endorses or shall be liable for the content of information provided by third parties. The SGX Group Companies may deal in investment products in the usual course of their business, and may be on the opposite side of any trades. SGX is an exempt financial adviser under the Financial Advisers Act (Cap. 110) of Singapore. The information in this document is subject to change without notice. This document may only be onward disseminated by the recipient wholly or in part if its content is attributed to SGX. This document shall not otherwise be reproduced, republished, uploaded, linked, posted, transmitted, adapted, copied, translated, modified, edited or otherwise displayed or distributed in any manner without SGX’s prior written consent.”