


Just out of curiosity, I wanted to see how the prices of new sales (developer launches) have moved across different districts in Singapore over the last 10 years.
The product of that short but tedious exercise of compiling charts has produced the following.
All the information was obtained from Squarefoot research.
The charts show
Average prices of non-landed residential new sales Number of units sold in each month Over the last 10 years
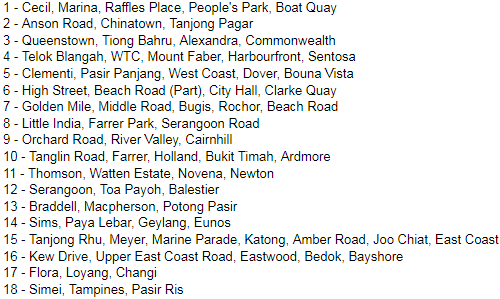
For some districts such as 6 (High Street, Beach Road, City Hall and Clarke Quay), there weren’t many new launches over the last 10 years so the price chart may be a little skewed.
For districts that have more new launches, such as district 15 (Tanjong Rhu, Meyer, Marine Parade, Katong, Amber Road, Joo Chiat and East Coast), the price chart is smoother as prices for many transactions are averaged out.
First, let’s recap on how many residential ......


