Invest
STI Analysis — the next peak and trough ? (43)
By ccloh Strategic Investor Zone  •  April 2, 2019
Continued from STI Analysis -- the next peak and trough ? (42)

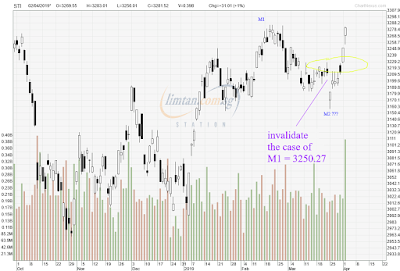
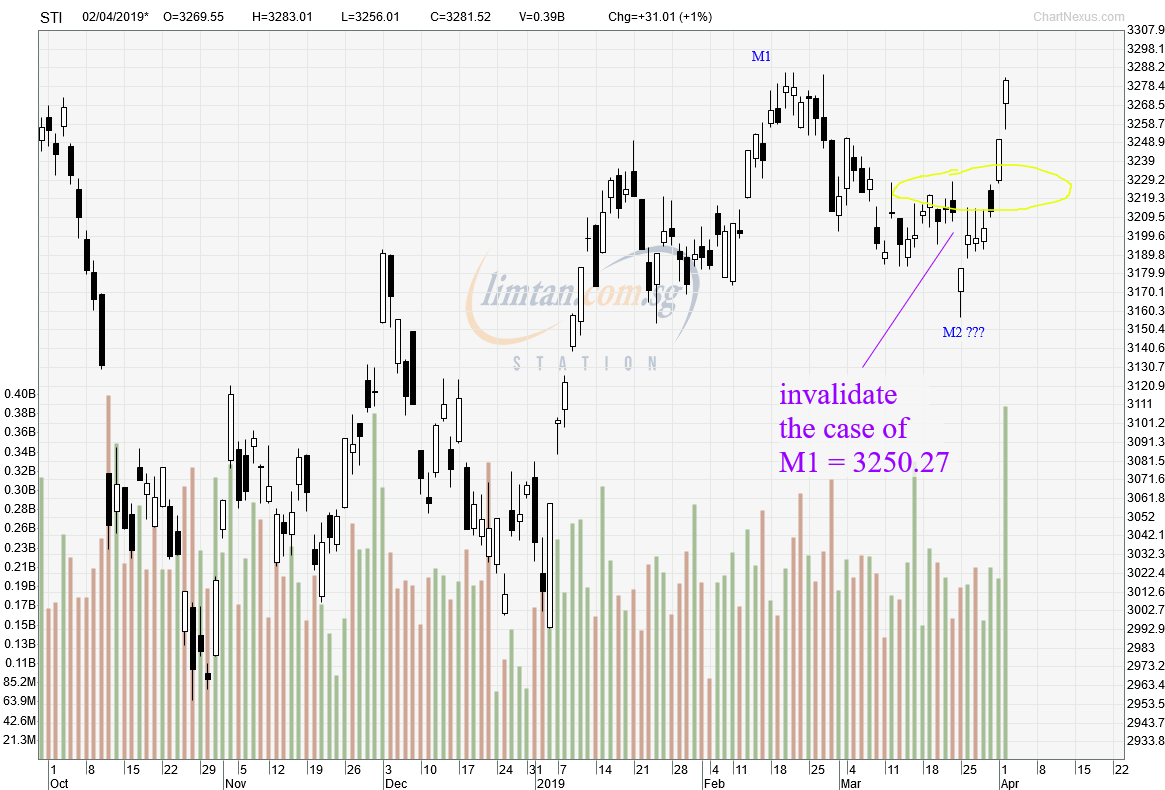
In previous analysis it was mentioned STI fell into 2 scenarios -- M1 at 3250.27 and M2 at 3286.08.  The break above 3228.38 on 1st Apr 2019 has invalidated the M1 at 3250.27 scenario as it doesn't fit into any Elliott wave correction pattern.  Thus, STI now left with the scenario of M1 at 3286.08.

The above chart illustrates the invalidation for the scenario of M1 at 3250.27.  Though now M1 is at 3286.08 but whether M2 has completed at 3156.79 on 25th Mar 2019 is still too early to tell.  Despite the intra-day high of 3283.01 today, the present upward movement could be still wave B of the correction pattern with wave A at 3156.79.  Wave B, depending on the pattern of the correction, could rise to as high as 138.2% Fibonacci ratio of wave A and in this...
Read the full article
By ccloh Strategic Investor Zone
Am a typical retail investor who started investing in stock market in 1993, the same length of period as SingTel was listed in SGX and ironically SingTel was my first vested stock. Back then was a passive investor and started to turn more active in stock market in 2006. A year later when I switched my engineering job to a finance related one, I became what commonly known as trader ( trade for living ) and at the same time also strongly believe in fundamental/value investing that is the way to growth wealth. In a way I classify myself as a "Strategic Investor". As a trader, I track market movement daily and as an value investor, I am always on the lookout for cheap bargain to hold for long term.
LEAVE A COMMENT
LEAVE A COMMENT

Your email address will not be published.

*

Your Email Address will not be published
*

Read More Articles
More from thefinance