


In this post, we look at the price and volume movements of S-REITs and STI Components, week on week. Tidied up the presentation a bit, let me know if you prefer the previous one!
S-REITs
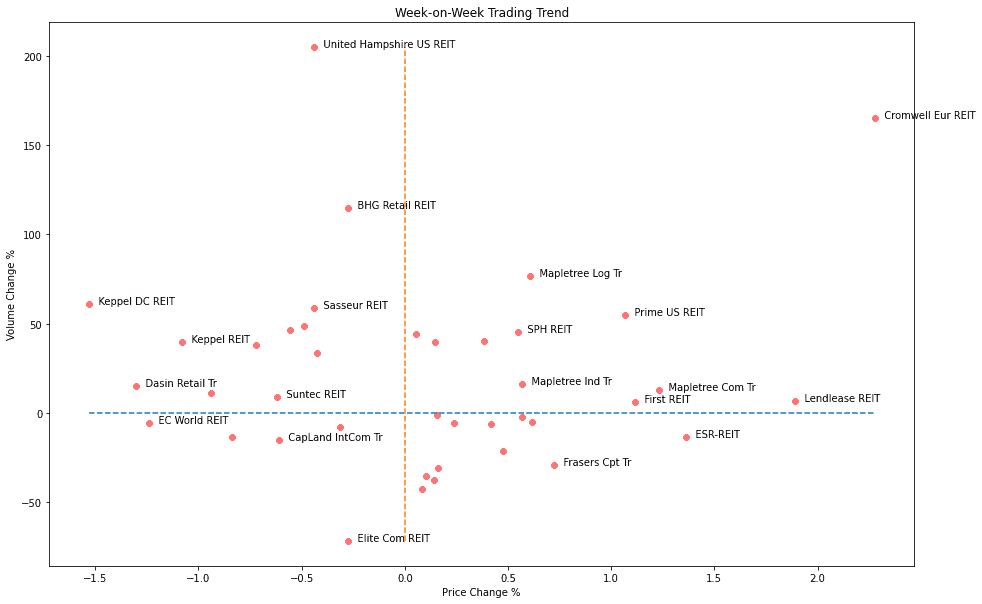
See my previous post for how the values are derived. This week, REITs had no clear trend as a whole, be it volume or price wise. Majority of them fell between the [-50% to +100%] and [-1% to 1.5%] intervals for volume and price changes respectively.
Sector Level:
Ranking: This table shows the top 3 gains and drops in week-on-week volume, which can be considered as a proxy for general investor interest.
Apart from the above indicator for general interest, the below table looks as weekly price changes, which can be considered as a proxy for which counters investors find more favorable/attractive this week.
(adsbygoogle...


