It's time to look at the past year performances of the various ETFs (eg. region-based, sector-based) and individual stocks (eg. top 3 of S&P 500 etc). Please take note that this list is not exhaustive but just cover some of the more common ETFs/stocks which most retail investors are aware of.
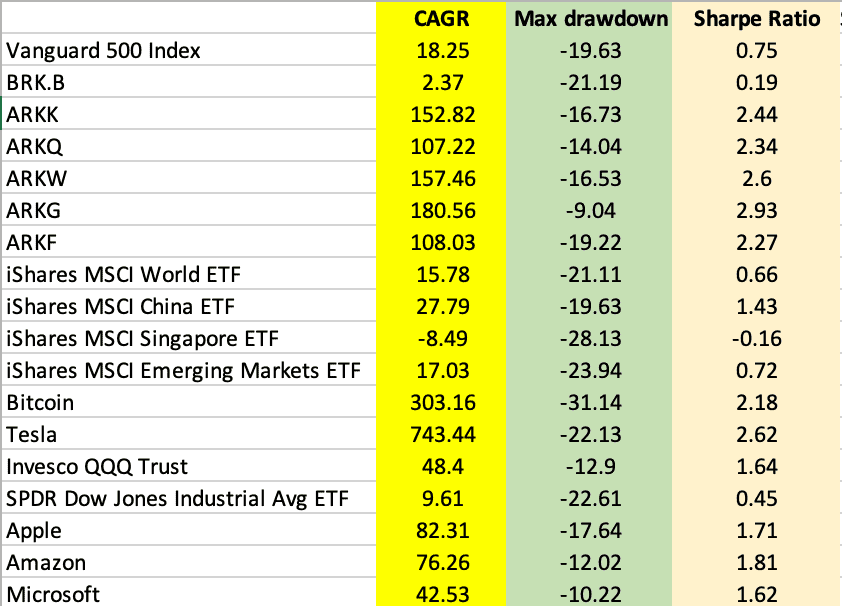
Below is the performance table with 3 main categories (CAGR, Max Drawdown, Sharpe Ratio- if you were to own the individual ETF/stock 100% in your portfolio).
While the year 2020 didn't started off great (with the rapid drops in March) amid the whole COVID-19 pandemic, you could see from the table above that most of the ETFs and stocks in the list here have fantastic growth. Most of them ended the year in double digit growths despite having also double digit drawdowns at some point of the year. If you were to randomly just hold any one of the tickers in this list...