Dear all,
This week, Chasen catches my attention as it seems to be forming a bullish double bottom on its chart. I have appended my personal chart analysis, together with some potential positive and negative points on the company. Read on for more below.
Chasen’s chart analysis
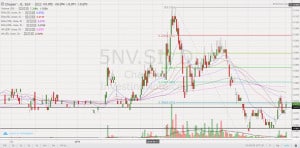
Based on my personal interpretation of Chasen’s chart, it seems to have tested its double bottom neckline around $0.070-0.072 for the past few days. For the past two days, it managed to close higher consecutively with above average volume. In fact, Chasen closed today with 7.3m shares changing hands, 3.8x above its average 30-day volume. ADX closed at 22.6, amid positively placed DIs (indicative of a trend). Other indicators such as OBV and MACD are strengthening.
A sustained break above $0.072 with volume expansion points to an eventual technical target of around $0.079. Chasen closed at $0.073 today.
Near term supports: S$0.072
...