On Thursday, SPH broke the resistance at $3.95 and closed at $3.96 with LOW volume of 2.28 million shares traded.
A white candle stick with long upper shadow affirms on the weakness of the rally as investors took profit on the gains.
RSI & MACD are flat as MACD lines converge together.
Important Resistance of SPH: $4.02
Immediate Support of SPH: $3.95
Currently prices are supported by 20/100 days MA at $3.95
Although prices broke the $3.95 resistance on Thursday but the buying volume is low and investors took profit on the gains. This is a bearish signal and indicates that investors have no confidences on the stocks.
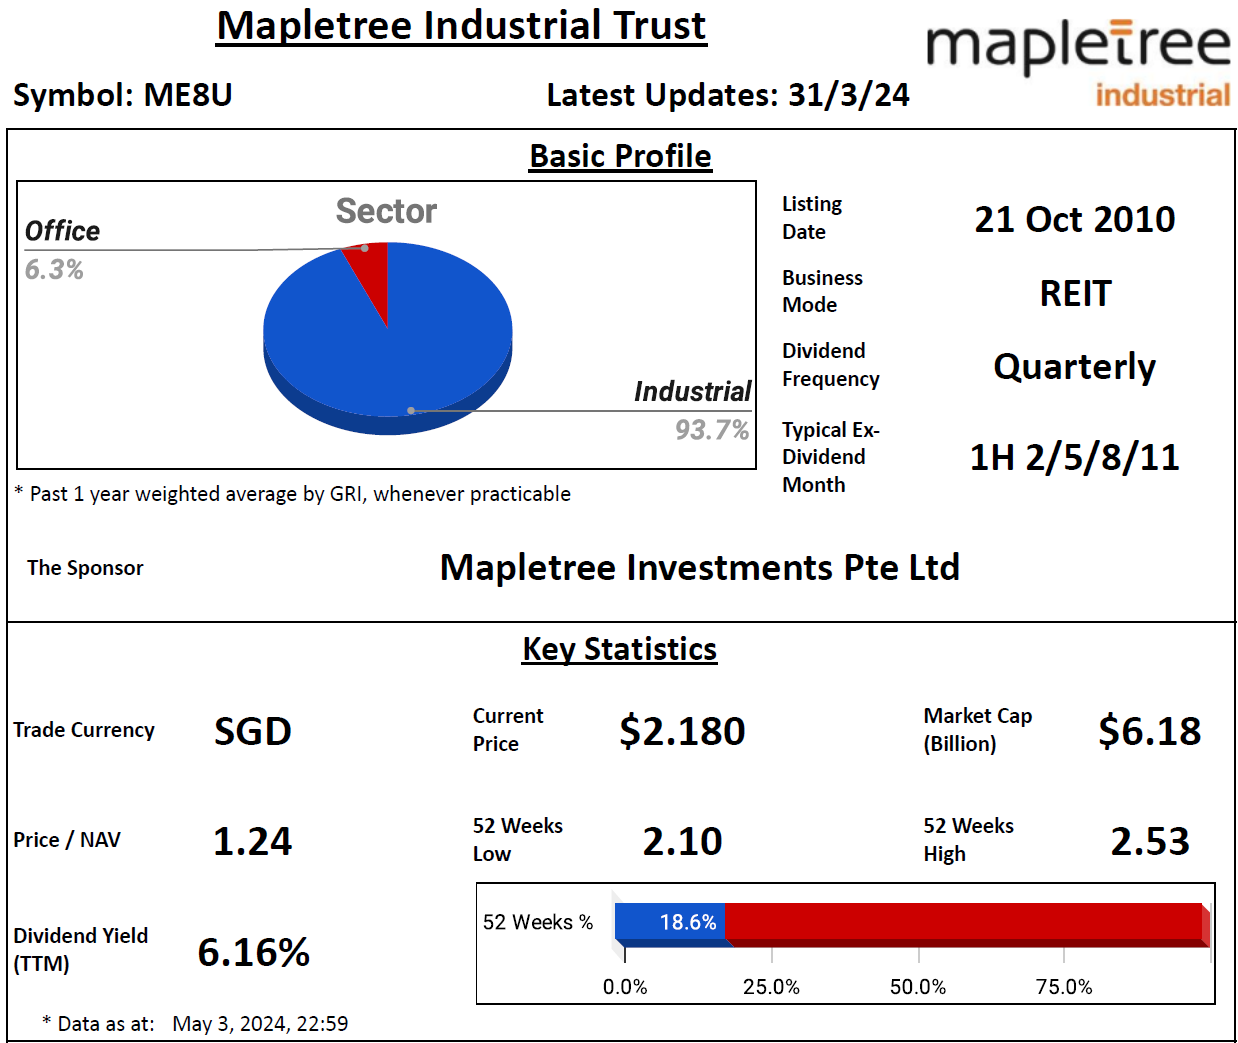
03 May 2011 Ex-Dividend
DIVIDEND : SGD 0.07 ONE-TIER TAX
Record Date: 05 May 2011
Payable Date: 24 May 2011
We would not expect SPH to pullback yet as investors are likely to hold ...
...